- Journal List
- Europe PMC Author Manuscripts
- PMC6861129

A nutritional memory effect counteracts benefits of dietary restriction in old mice
Oliver Hahn
1Max Planck Institute for Biology of Ageing, 50931 Cologne, Germany
2Cellular Networks and Systems Biology, CECAD, University of Cologne, 50931 Cologne, Germany
3Department of Neurology and Neurological Sciences, Stanford University School of Medicine, Stanford, California, USA
Lisa F. Drews
1Max Planck Institute for Biology of Ageing, 50931 Cologne, Germany
Takashi Tatsuta
1Max Planck Institute for Biology of Ageing, 50931 Cologne, Germany
Lisonia Gkioni
1Max Planck Institute for Biology of Ageing, 50931 Cologne, Germany
Oliver Hendrich
1Max Planck Institute for Biology of Ageing, 50931 Cologne, Germany
Qifeng Zhang
4Inositide lab, The Babraham Institute, Cambridge, CB22 3AT, UK
Thomas Langer
1Max Planck Institute for Biology of Ageing, 50931 Cologne, Germany
Scott Pletcher
5Department of Molecular & Integrative Physiology and the Geriatrics Center, University of Michigan, Ann Arbor, 48109 U.S.A., 48109, U.S.A
Michael J. O. Wakelam
4Inositide lab, The Babraham Institute, Cambridge, CB22 3AT, UK
Andreas Beyer
2Cellular Networks and Systems Biology, CECAD, University of Cologne, 50931 Cologne, Germany
6Center for Molecular Medicine Cologne, University of Cologne, 50931 Cologne, Germany
Sebastian Grönke
1Max Planck Institute for Biology of Ageing, 50931 Cologne, Germany
Linda Partridge
1Max Planck Institute for Biology of Ageing, 50931 Cologne, Germany
7Department of Genetics, Evolution and Environment, Institute of Healthy Ageing, University College London, London WC1E 6BT, UK
Associated Data
- Supplementary Materials
- Supplementary Table 5.GUID: 26ACE545-57ED-4C4E-8380-AD59AE89EE39Supplementary Table 1-4.GUID: A30ECE56-C7C8-4EE7-B3E7-540CC0E55254
Abstract
Dietary restriction (DR) during adulthood can greatly extend lifespan and improve metabolic health in diverse species. However, whether DR in mammals is still effective when applied for the first time at old age remains elusive. Here, we report results of a late-life DR switch experiment employing 800 mice, in which 24 months old female mice were switched from ad libitum (AL) to DR or vice versa. Strikingly, the switch from DR-to-AL acutely increases mortality, whereas the switch from AL-to-DR causes only a weak and gradual increase in survival, suggesting a memory of earlier nutrition. RNA-seq profiling in liver, brown (BAT) and white adipose tissue (WAT) demonstrate a largely refractory transcriptional and metabolic response to DR after AL feeding in fat tissue, particularly in WAT, and a proinflammatory signature in aged preadipocytes, which is prevented by chronic DR feeding. Our results provide evidence for a nutritional memory as a limiting factor for DR-induced longevity and metabolic remodeling of WAT in mammals.
Introduction
Dietary restriction (DR), i.e. reduced food intake while avoiding malnutrition, profoundly extends lifespan in most model and non-model organisms, including rodents and, potentially, humans 1. Even when applied short-term, DR rapidly induces a broad-spectrum improvement of metabolic health 2,3 and acutely enhances survival in disease models of hypertrophy and ischemia reperfusion injury 2,4. Considering the therapeutic potential of DR-related nutritional and pharmacological interventions for treating age-related diseases in humans 5 it is thus pivotal to examine if these pervasive benefits can be effectively induced at any time point in life.
In fruit flies, DR instigated at young or old age acutely lowers age-specific mortality, independent of prior diet, whilst switching long-term DR fed flies back to ad libitum (AL) feeding causes an equally acute and almost complete elevation of mortality 6. However, late-onset DR experiments in rodents older than 12 months 7,8 have yielded contradictory results 9,10, which may in part be attributable to varying experimental designs. Furthermore, previous studies in mice have quantified the response to DR mainly by focusing on survivorship, which is a cumulative measure, and thus not suitable to detect acute effects. Age-specific mortality, in contrast, measures the instantaneous hazard of death at a given moment in life, but it requires larger cohort sizes 11,12. Profiling mortality dynamics in large cohorts of mice could, therefore, resolve whether DR improves health acutely when applied for the first time in old individuals. Similarly, age-specific mortality could identify lasting protective effects of long-term DR after switching back to unrestricted feeding.
The effects of DR are mediated in part by tissue-specific shifts in patterns of gene expression. In mice and primates, transcriptional profiling has suggested changes in energy homeostasis, mitochondrial function and lipid metabolism as key processes by which DR improves health at old age 13–17. Two integrative meta-analyses of cross-tissue transcriptome datasets commonly identified differential regulation of lipogenic genes as a key signature of DR in mammals 14,18. Consistently, lipid profiles change during normal ageing, whilst DR and related lifespan-extending interventions remodel lipid composition in C.elegans, Drosophila and mammals, and some of these changes are causal and essential for increased lifespan 19.
Further evidence for a causal role of lipid metabolism under DR in mammals comes from the correlation of maintenance of fat mass with a stronger lifespan extension under DR in inbred 20 and recombinant inbred mouse strains 21. However, the precise role of lipid metabolism in mammalian longevity is probably complex and tissue-specific. In the liver, DR causes transcriptional repression of the key lipogenic transcription factor Srebf1 and its related target genes, paralleled by reduced triglyceride (TG) content 22, which may protect the tissue from age-related onset of steatosis. In contrast, the white adipose tissue (WAT), classically regarded as responsible for storing fat, responds to DR by strong up-regulation of de-novo lipogenesis genes and elevated phospholipid (PL) levels 23. The role of WAT-specific shifts in lipogenesis and phospholipid metabolism in improved health under DR is, however, still unknown.
We have investigated the effect of late-onset AL and DR feeding in a large cohort of mice. While newly imposed AL feeding resulted in a rapid, steep increase in mortality, switching the mice from AL to DR feeding resulted in only a slight decrease in mortality rate, which remained much higher than in chronically DR animals. Individual mice that preserved their fat content after the switch to DR showed a greater drop in mortality. In brown (BAT) and white adipose tissue, the RNA transcript profiles of previously AL mice remained largely refractory to late-life DR, which coincided with major age-related shifts in white adipose progenitor cells. Both switch-resistant genes and lipidomic profiles of WAT pointed to impaired membrane lipogenesis and mitochondrial biogenesis in response to late-life DR. A nutritional memory thus limited both increased survival and metabolic remodeling of WAT in response to DR imposed late in life.
Results
Acute mortality shift in response to late onset AL but not late onset DR in mice
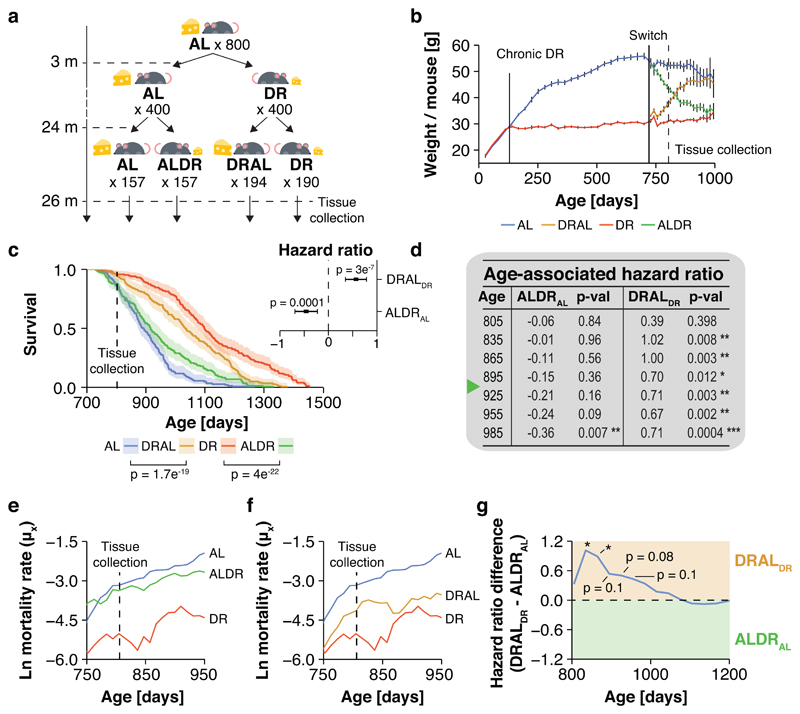
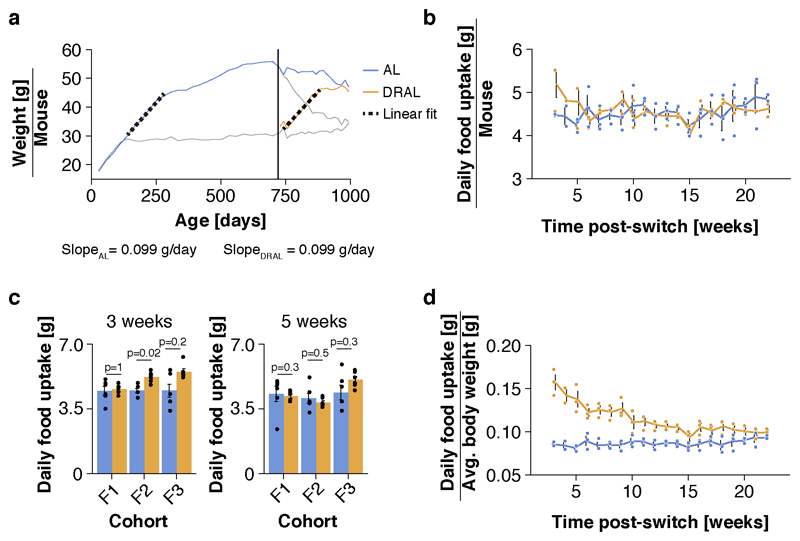
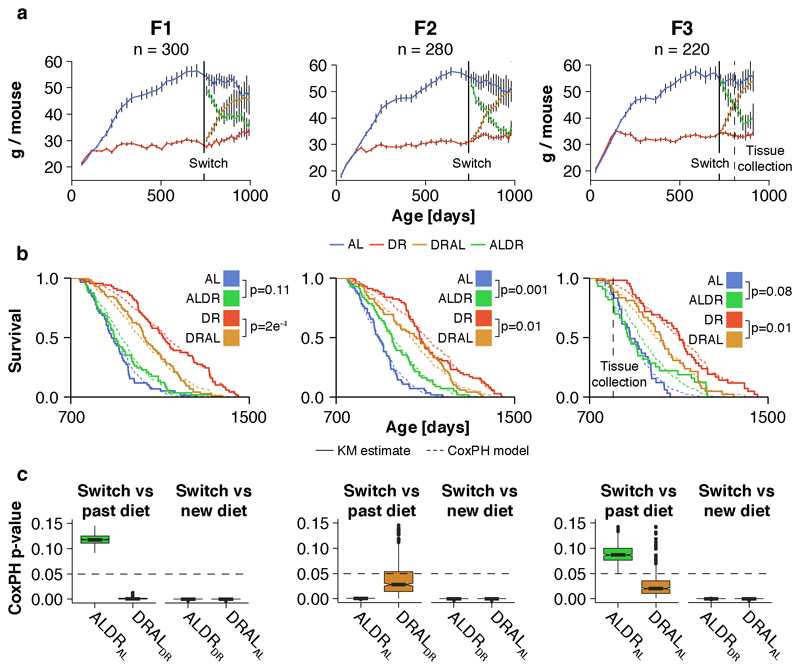
We conducted a diet switch experiment in mice (Fig. 1a), using 800 females of the B6D2F1 hybrid strain, which show a robust lifespan extension under DR feeding 22,24. This large number of animals enabled profiling of age-specific mortality. DR was introduced at 12 weeks of age, with stepwise restriction over 4 weeks to 40% of the food intake of AL controls, split over three breeding batches. A subset of the AL and DR animals was subjected to a diet switch after 20% of the AL fed animals had died, corresponding to 24 months of age (721 to 746 days, depending on breeding cohort), which we estimated to achieve >95% power to detect a reversal in mortality rates over a 6 month period and maximized statistical power to detect changes in mortality rate. Half of the AL cohort was subjected to stepwise DR over 4 weeks (late-onset DR; ALDR), while half of the chronic DR fed mice received a reciprocal food increase back to the level of AL controls (late-onset AL; DRAL). Both diet switches caused equivalent weight gain and loss to those seen with chronic AL or DR feeding, respectively, reaching the level of the chronic diet groups within 8 months post-switch (Fig. 1b). The rate of weight gain of old DRAL mice was highly similar to that observed in young AL animals (Extended Data Fig. 1a). While absolute food intake was comparable between old AL and DRAL mice (Extended Data Fig. 1b-c), relative to their lower body weight, DRAL animals exhibited a slightly higher food intake (Extended Data Fig. 1d). Thus, 21 months of DR feeding did not permanently lower the endogenous food intake target of these mice.
a, Schematic representation of the switch experiment. Animal numbers per treatment group are indicated. b, Body weights for chronic and switch diet cohorts (mean ± 95% confidence intervals). Solid lines indicate when chronic DR and diet switches were applied. Dashed line indicates tissue collection time point. n=45 biologically independent animals per diet. c, Post-switch Kaplan-Meier survival curves for chronic and switch diet cohorts. Data represents n=157 (AL), n=157 (DR), n=190 (DR) and n=194 (DRAL) biologically independent animals. Solid lines represent KM fit, shaded area represent the 95% confidence interval. Cox regression was used to avoid making assumptions about the shape of the trajectories. Late-onset DR (ALDR) mice differed significantly in their hazard ratio from both chronically DR fed (hazard ratio = 1.16, p < 0.0001; Wald statistic) and ad libitium (AL) fed mice (hazard ratio = -0.46, p < 0.0001; see inset; Wald statistic). Late-onset AL (DRAL) mice differed significantly in their hazard ratios to both chronically AL fed (hazard ratio = -1.05, p<0.0001) and DR fed mice (hazard ratio = 0.5, p < 0.0001; see inset). Centres represent hazard ratio, error bars the standard error (SE). d, Post-switch hazard ratios of ALDR fed mice relative to chronic AL fed animals (middle columns) and DRAL fed mice relative to chronic DR fed animals (right columns). To profile age-specific effects, Cox regression analysis was restricted to animals dying before indicated age. Green mark indicates median lifespan of ALDR cohort. e, f Age-specific, log-transformed mortality rates of mice in response to ALDR e and DRAL f switch diets. Mortality rates were truncated after the AL cohort had reached 20% survival (30 mice <). Data represents n=157 (AL), n=157 (DR), n=190 (DR) and n=194 (DRAL) biologically independent animals. g, Hazard ratio difference between both switch diets after normalizing against corresponding pre-switch diet groups (Wald statistic). Cox regression analysis was restricted to animals dying before indicated age or until the AL cohort had reached 25% survival (40 mice).
Animals switched to DR showed only a delayed and incomplete reduction in mortality rate compared to chronic DR mice (Fig. 1c-e and Extended Data Fig. 1b). For the first seven months after the switch, during which their median lifespan was passed, ALDR mice showed no significant improvement in mortality (Fig. 1d,e). When analyzing survival data for the whole duration of the experiment, two out of three breeding cohorts showed no significant response to the ALDR switch. (Extended Data Fig. 1b,c). Therefore, late-onset DR caused no measurable increase in survival in a large fraction of old animals. In stark contrast, the reciprocal switch from DR to unrestricted feeding caused an acute increase in mortality in all three breeding cohorts (Fig. 1d,f and Extended Data Fig. 2b-c). For the first four months post-switch, the shift in mortality relative to the prior diet group was significantly higher for the DRAL switch than for the ALDR switch, before gradually reduced mortality under ALDR reached a similar effect size (Fig. 1g). This further suggests that long-term DR late in life induced partial protection against mortality, consistent with observations in long-term DR flies 6. Age-specific mortality in the mice was thus dependent on past nutrition, and this dependency was stronger for a history of AL than of DR feeding.
Preservation of body weight associates with late onset DR outcome
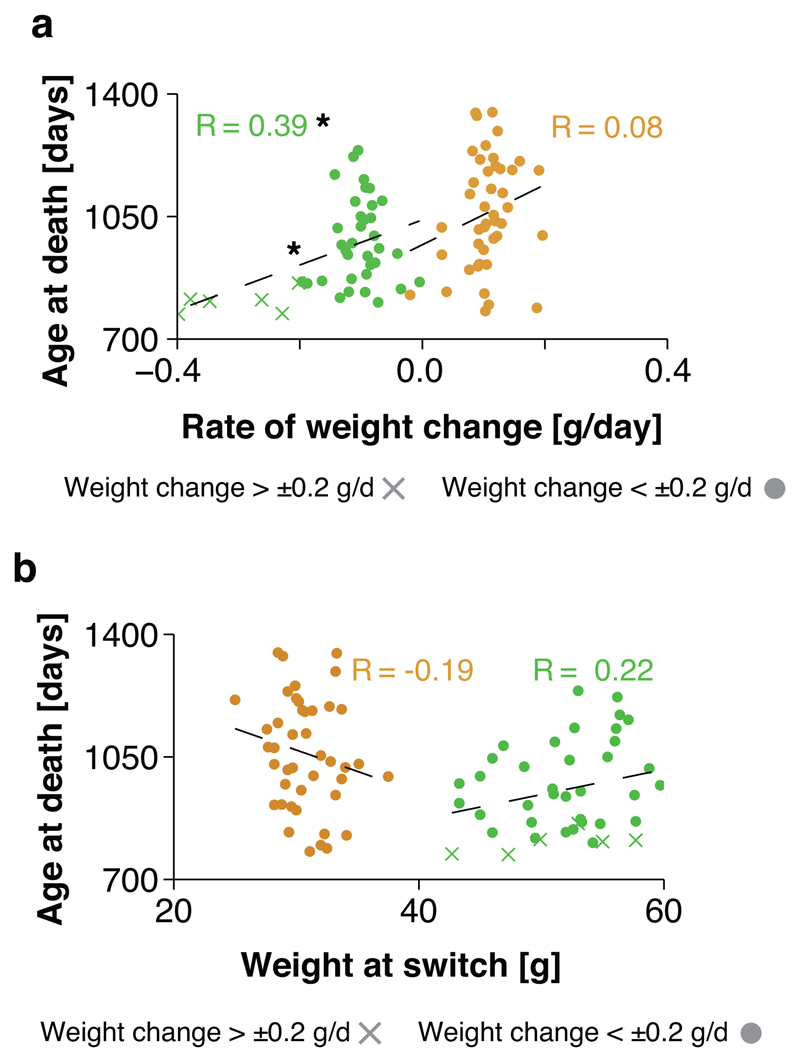
The strong effect of a history of AL feeding on subsequent mortality under DR could indicate the presence of a physiological memory that may impede the molecular changes mediating the benefits of DR. Interestingly, there was a significant inverse association between the animal-specific rate of weight change and age at death for the ALDR but not DRAL cohort (Fig. 2a). There was, however, no association between the absolute weight pre-switch and lifespan in either of the switch groups (Fig. 2b). In agreement with previous findings on chronic DR regimens 20,21, preservation of weight and, specifically, fat may thus increase the responsiveness of survival to late-onset DR, implicating a role of lipid metabolism.
a, Scatterplot representation of mouse-specific rates of weight change versus mouse-specific age at death for both ALDR and DRAL switch cohorts. Linear regression analysis found a significant association for weight change and age at death for the ALDR switch cohort. Animals with a weight loss higher than 0.2 g/d are marked. b, Scatterplot representation of mouse-specific weights at switch date versus mouse-specific age at death for both ALDR (green) and DRAL (orange) switch cohorts. Linear regression found no significant association. Animals with a weight loss higher than 0.2 g/d are marked. n=45 biologically independent animals per diet.
Brown and white adipose tissue but not liver show a transcriptional memory of AL feeding
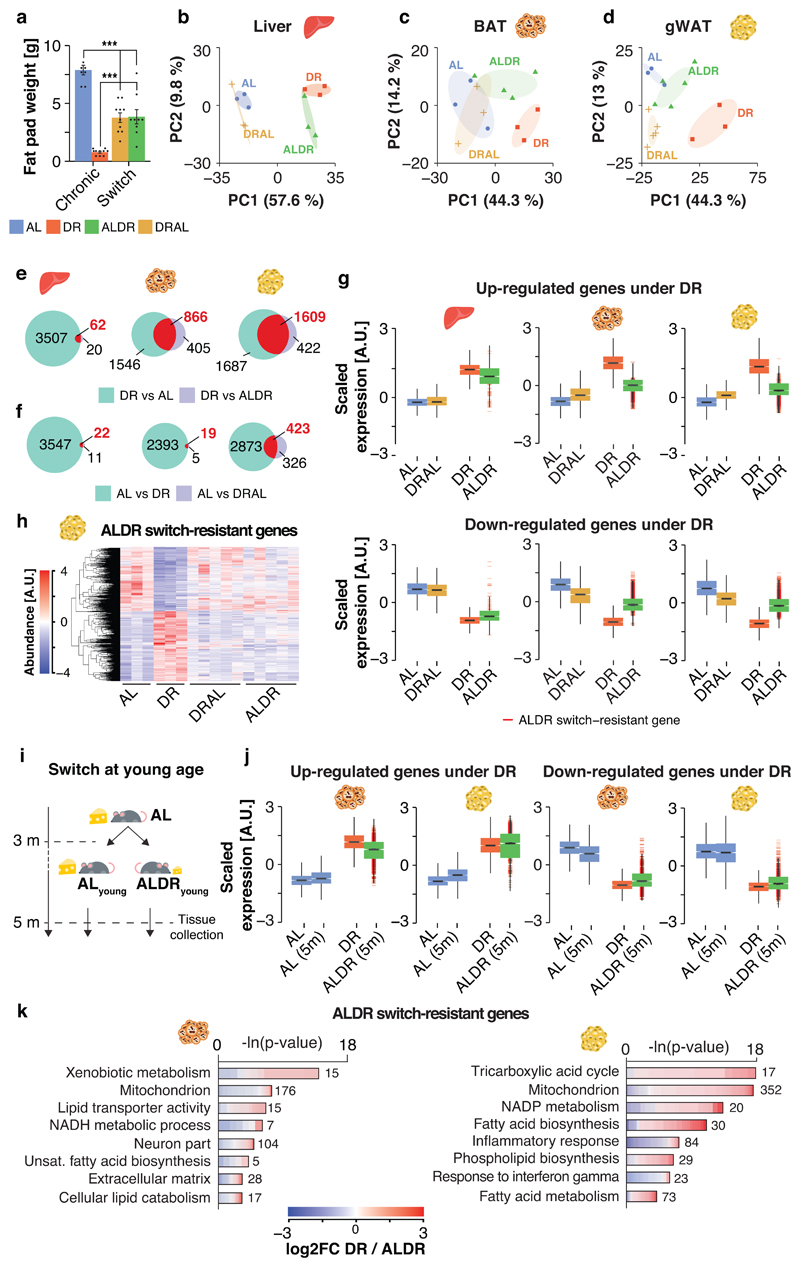
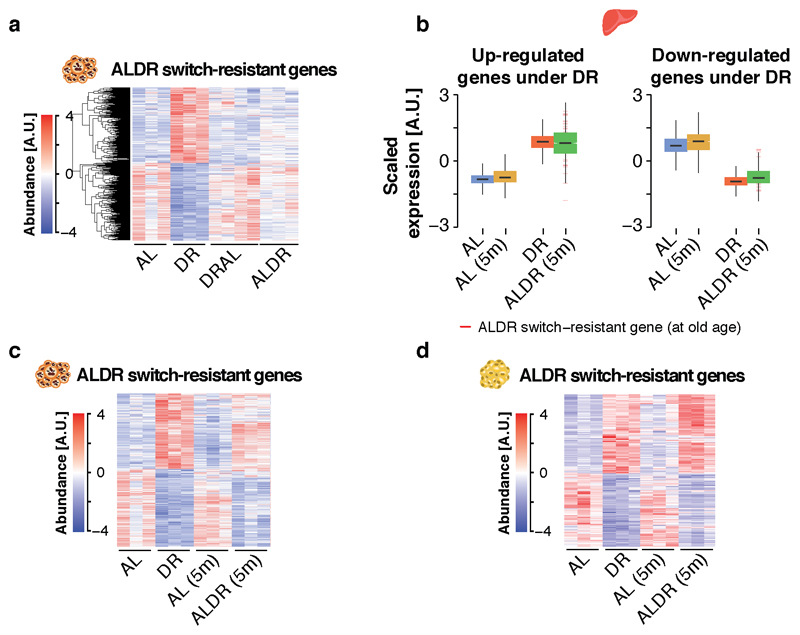
In the light of a possible memory effect of AL feeding on lipid metabolism, we next investigated the molecular memory of AL feeding in liver, brown and gonadal white adipose tissue (BAT and WAT), which fulfill key functions in lipid turnover and storage. Tissues were sampled two months post-switch, when the effects on mortality were the most disparate between the two switch diets (compare Fig. 1e-g). In contrast, body (Fig. 1b) and adipose weights (Fig. 3b,c) indicated that the two diet switches had already caused comparable changes in fat tissue mass at this time point (Fig. 3a). RNA-seq profiling revealed high transcriptional similarity between DRAL mice and chronic AL controls in all three tissues, indicating that late-onset AL feeding induced a transcriptional profile similar to chronic AL feeding. Similarly, hepatic transcriptional profiles from ALDR mice clustered with the DR controls. In strong contrast, in BAT and even more in WAT, ALDR profiles clustered with those of the AL diet (Fig. 3c,d), and were thus resistant to the diet switch. Chronic DR caused significant expression changes in 3569 genes in liver, 2412 in BAT and 3296 in WAT, when compared to AL controls. Of these, only 62 genes (~2%) in the liver, but 866 genes (~35%) and a total of 1609 genes (~50%) in the WAT, were still differentially expressed between DR and ALDR mice two months post-switch (Fig. 3e). These “switch-resistant” genes in the adipose tissues are candidates for a transcriptional memory of AL feeding. In DRAL switch mice, we detected only 22 (0.8%) switch-resistant genes in the liver, 19 (0.08%) in BAT and 423 (~13%) switch-resistant genes in the WAT (Fig. 3f).
a, Organ weight of gonadal fat pads at dissection time point (805 days). One-way ANOVA followed by two-sided post-hoc Tukey test; n=10 biologically independent animals per diet. Means ± SEM. b-d, Principal component analysis plot of RNA-seq data in b liver, c brown adipose tissue (BAT) and d gonadal white adipose tissue (WAT). e-f, Venn diagrams depicting the overlap of differentially expressed genes in liver, BAT and WAT e under DR feeding, relative to the AL or ALDR group; and f under AL feeding, relative to the DR or DRAL groups. Switch-resistant genes are highlighted in red. g, Boxplot representation of scaled expression levels of differentially up- and down-regulated genes under chronic DR as opposed to chronic AL controls in all three tissues. Expression levels of ALDR switch-resistant genes are indicated Boxplots. Scatterplots depicting the expression change for each gene under DR or ALDR feeding (relative to AL). Whiskers represent 1st and 5th quartile, box edges represent 2nd and 4th quartile and centre line represents 3rd quartile/median. h, Heatmap of unsupervised clustering of expression changes for ALDR switch-resistant genes in WAT; color bar represents z-score range. i, Schematic representation of the DR switch experiment in young mice. j, Boxplot representation of scaled expression levels of differentially up- and down-regulated genes under chronic DR as opposed to chronic AL controls in BAT and WAT of ALDR switch mice at young age. Boxplots are defined as in g, k Representative Gene ontology (GO) enrichment of ALDR switch-resistant genes in BAT (left) and WAT (right). Lengths of bars represent negative ln-transformed p-values using two-sided Fisher’s exact test. Cells indicate gene-wise log2-foldchanges (log2FC) between DR and ALDR fed mice. The complete list of enriched GO terms can be found in Supplementary Tables 2 and 3. Biologically independent animals used for RNA-seq: Liver: n=3 (AL, DR, ALDR, DRAL, ALDR 5m, AL 5m); BAT: n=3 (AL, DR, DRAL, AL 5m, ALDR 5m) n=5 (ALDR); WAT: n=3 (AL, DR, ALDR, AL 5m) n=5 (ALDR, DRAL). *** p<0.0001.
To analyze the transcriptional similarity between chronic and newly DR animals, we focused on genes that were differentially up- or down-regulated under chronic DR (Fig. 3g). Plotting for each gene the scaled expression in response to chronic or late-onset DR confirmed an almost complete transcriptional adaptation to the ALDR switch in the liver, while both adipose tissues remained largely refractory (Fig. 3g). Corresponding to the acute rise in mortality, DRAL mice broadly adopted the expression profile of chronic AL fed animals across tissues, as did ALDR mice in the liver. (Fig. 3g). In addition, unsupervised hierarchical clustering revealed that ALDR switch-resistant genes in adipose tissues were not resistant in general, because their expression adopted an AL-like pattern under the reciprocal DRAL switch (Fig. 3h and Extended Data Fig. 3a). Thus, the liver transcriptome remained acutely responsive to either diet change, whilst the adipose tissue was specifically unresponsive to late-onset DR.
The incomplete reprogramming of RNA expression in response to late-onset DR could simply indicate that the adipose tissues respond slowly to DR, which would argue against the presence of a specific memory of AL feeding. To investigate this possibility, we repeated the experiment in young mice by switching AL fed animals to DR (young ALDR) starting at 12 weeks of age (Fig. 3i). Identical to the experiment in old mice, tissues were collected two months post-switch for expression profiling. Strikingly, there was a complete transcriptional reprogramming in all three tissues (Fig. 3j and Extended Data Fig. 3c,d). Genes that were resistant to the switch in old ALDR mice showed full sensitivity in young ALDR mice. Thus, the adipose tissue transcriptome was highly responsive to newly applied DR switches in young mice, but this transcriptional flexibility markedly declined with age, in particular in the WAT.
Taken together, switching mice from DR back to full feeding caused a rapid loss of DR-related RNA expression patterns, implying no or only a weak memory of prior DR regimen. In contrast, chronic AL feeding caused the formation of an adipose-tissue-specific gene expression memory over time. This reduced transcriptional flexibility of BAT and WAT in response to DR mirrored the resistance of age-specific mortality to late-onset DR.
Chronic AL feeding causes a proinflammatory expression pattern in preadipocytes
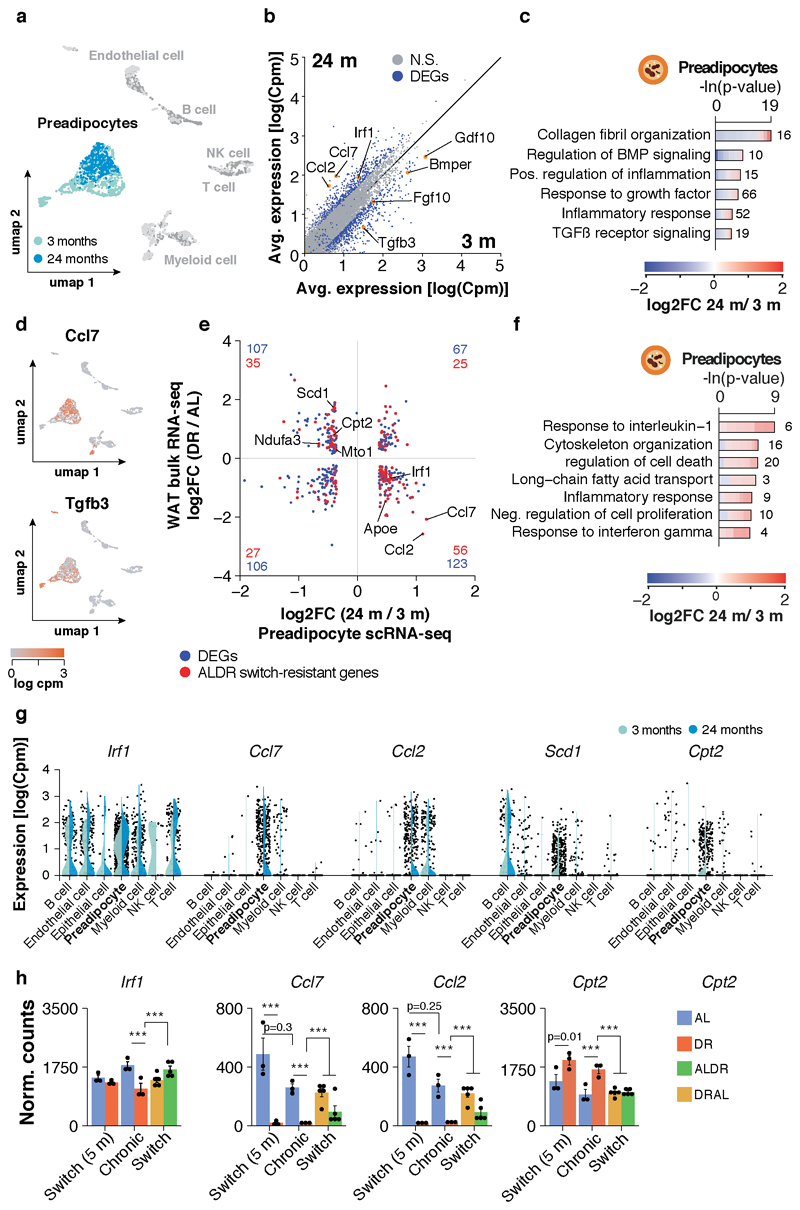
Age-related changes have been previously identified to impair the differentiation of WAT preadipocytes into brite adipocytes under cold-exposure in aged mice 25–27, and we hypothesized that a similar process could contribute to the reduced transcriptional flexibility of the WAT in old AL mice. To test this hypothesis, we obtained publicly available single cell (sc) RNA-seq data of the gonadal stromal-vascular-fraction (SVF) from the Tabula muris consortium 28, comprising cells isolated from 3 and 24 months old AL fed mice. Indeed, preadipocytes from old mice exhibited profound transcriptional shifts, including decreased expression of growth/differentiation factors and elevated expression of inflammatory response genes and secretable cytokines such as Ccl2 and Ccl7 (Extended Data Fig. 4a-d). We further found a significant, inverse association between the gene expression changes in aged preadipocytes and those observed under DR with bulk RNA-seq. This association was still significant when limited to ALDR switch-resistant genes, which were functionally enriched for inflammatory response genes and chemokines (Extended Data Fig. 4e,f, Supplementary Table 1). Many of these genes were found to be particularly, or even exclusively, expressed in preadipocytes (Extended Data Fig. 4g,h). Thus, expression patterns in bulk RNA-seq may indeed reflect those found by scRNA-seq. Our analysis thus strongly suggests that preadipocytes lower the expression of growth/differentiation factors associated with WAT plasticity 29,30, while acquiring an inflammatory phenotype during ageing on AL diet. This phenotype appears to be strongly prevented by DR, but not by late-onset DR. The transcriptional memory of AL diet may thus be, in part, rooted in preadipocytes.
Mitochondrial biogenesis in WAT is impaired under late onset DR
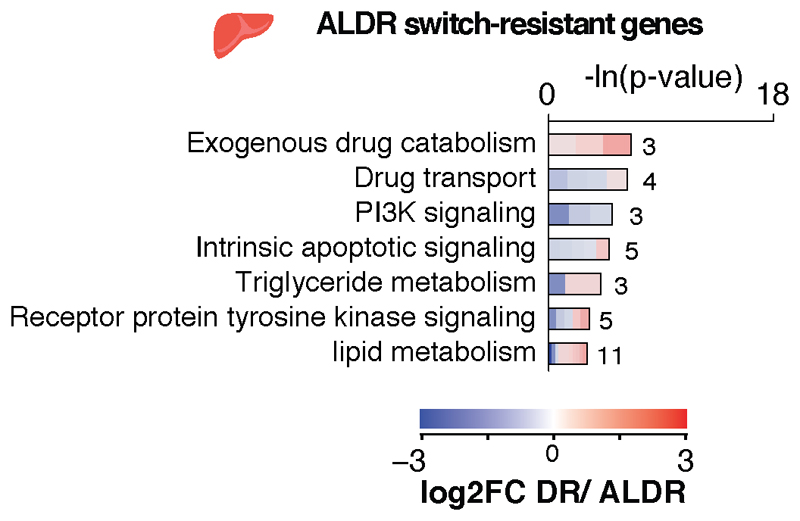
We next investigated the molecular pathways affected by the transcriptional memory of AL feeding, since these could point to mechanisms that improve health under chronic DR. Whereas switch-resistant genes in the liver showed no major gene ontology enrichment (Extended Data Fig. 5a), the corresponding analysis in BAT revealed increased lipid transporter activity and largely down-regulated mitochondrial function, including markers of uncoupling-dependent thermogenesis (Fig. 3k, Extended Data Fig. 6a-d; Supplementary Table 2). Switch-resistant genes in WAT showed the strongest functional enrichment for various mitochondria-related pathways, fatty acid metabolism and phospholipid biosynthesis, all of which were up-regulated under chronic and young ALDR but not old ALDR feeding (Fig. 3k; Supplementary Table 3). In addition, we identified a switch-resistant reduction of inflammatory response and interferon gamma-related genes. The increase in mitochondrial gene expression in WAT contrasts with the down-regulation of the same gene set in BAT, indicating that the declining transcriptional flexibility acts in a tissue-specific manner.
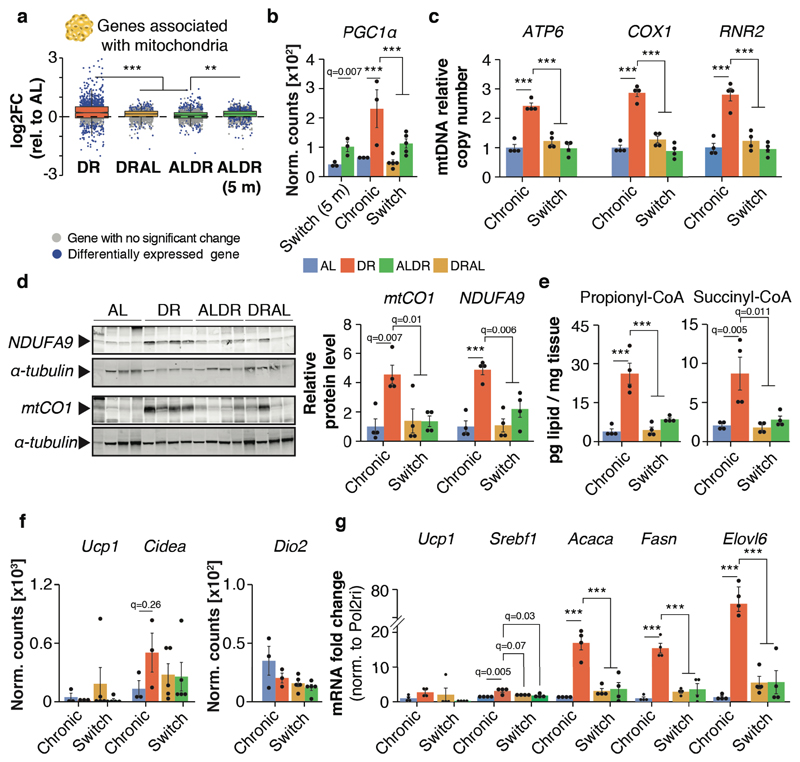
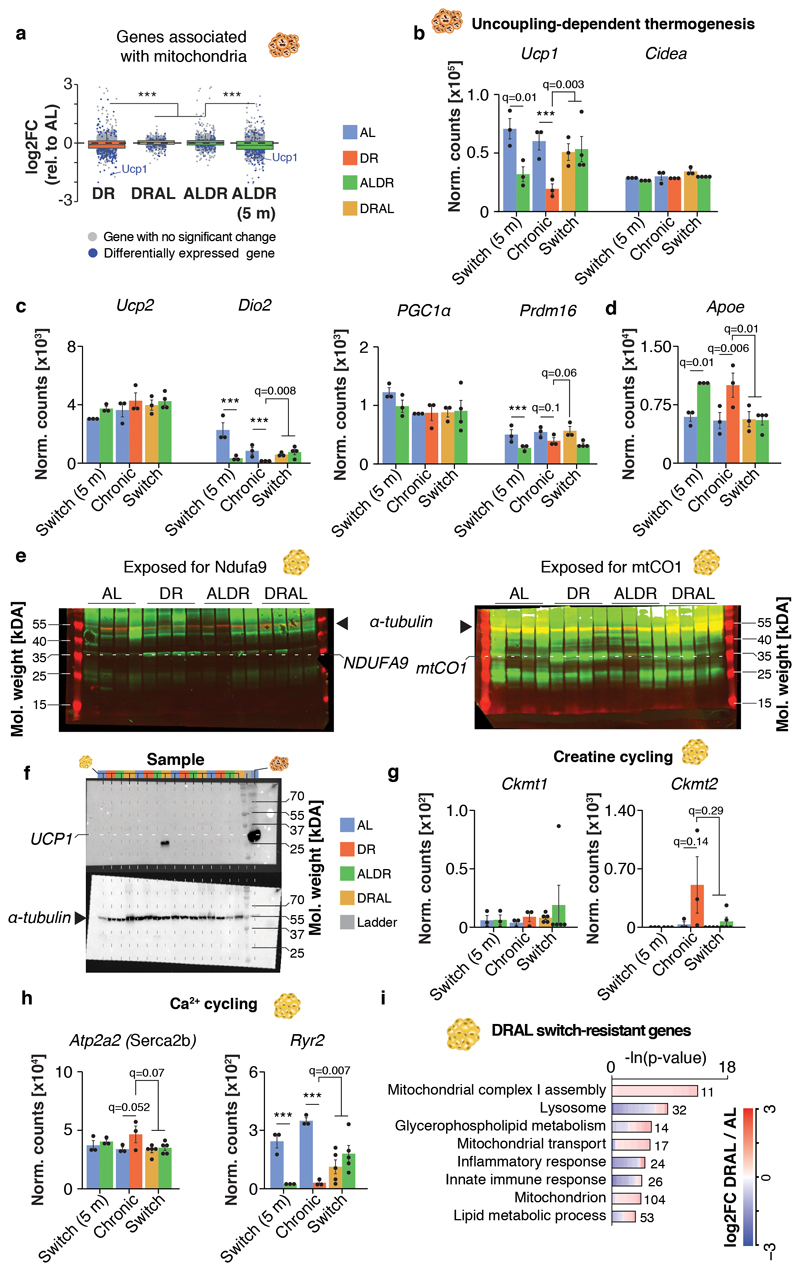
To test whether the shifts in gene expression could be correlated with functional consequences, we characterized the predicted switch-resistant up-regulation of mitochondrial function in the WAT, since this tissue exhibited the most switch-resistant genes and strongest functional enrichment. Indeed, genes associated with mitochondria in WAT (both nuclear and mitochondrially encoded genes) showed globally increased expression under chronic DR compared with either switch diet (Fig. 4a). Furthermore, expression of the transcription factor Pgc1α, a key driver of mitochondrial biogenesis, was significantly increased in chronic DR and in young ALDR mice but was resistant to the ALDR switch (Fig. 4b). Consistent with this observation, chronic DR induced increased abundance of mitochondrial DNA (mtDNA), protein levels of mitochondrial complex I and IV subunits (mtCO1; NDUFA9) and key mitochondrial metabolites (Propionyl- and Succinyl-CoA), all of which were resistant to the ALDR switch (Fig. 4c-e, Extended Data Fig. 6e). Of note, expression levels of various thermogenic processes such as UCP1 (uncoupling 31), Ckmt1 (Creatine cycling 32) and Serca2b (Ca2+ cycling 33) were unaffected by diet (Fig. 4f,g, Extended Data Fig. 6 f-h). Remarkably, all parameters of mitochondrial activity reverted back to the level of AL controls in the DRAL switch (Fig. 4b-e), in line with only weak mRNA expression differences between chronic and late-onset AL and only a small fraction of the DR–related transcriptional program still being active (Fig. 3f-h, Extended Data Fig. 6i, Supplementary Table 4). Long-term AL feeding thus interfered with elevated, uncoupling-independent mitochondrial biogenesis and activity in the WAT in response to late-onset DR.
a, Distribution of gene-wise expression changes in WAT under chronic DR and switch diets relative to chronic AL feeding for genes associated with the GO term ‘Mitochondrion’ (n = 1299 genes). Whiskers represent 1st and 5th quartile, box edges represent 2nd and 4th quartile and centre line represents 3rd quartile/median. Two-sided Wilcoxon rank-sum test, adjusted for multiple testing. b, Pgc1α (Ppargc1a) mRNA expression (RNA-seq) in WAT. Two-sided Wald test, adjusted for multiple testing. c, mtDNA copy number in WAT. One-way ANOVA, two-sided Tukey post hoc test. d, Western blot analysis of mtCO1 and NDUFA9 in WAT with α-tubulin as loading control. One-way ANOVA, two-sided Tukey post hoc test. e, Propionyl- and Succinyl-CoA levels in WAT. One-way ANOVA, two-sided Tukey post hoc test. f, mRNA expression (RNA-seq) of thermogenic marker genes in WAT. Two-sided Wald test, adjusted for multiple testing. g, mRNA expression (qRT-PCR) of Ucp1, Srebf1, Acaca (ACC), Fasn and Elovl6 in the WAT relative to Pol2ri. One-way ANOVA, two-sided Tukey post hoc test. Biologically independent animals used: RNA-seq: n=3 (AL, DR, ALDR, AL 5m) n=5 (ALDR, DRAL); Western blot, qPCR and lipidomics: n=4 per diet. Means ± SEM, *** q<0.0001.
De novo lipogenesis in WAT exhibits the strongest memory of prior AL feeding
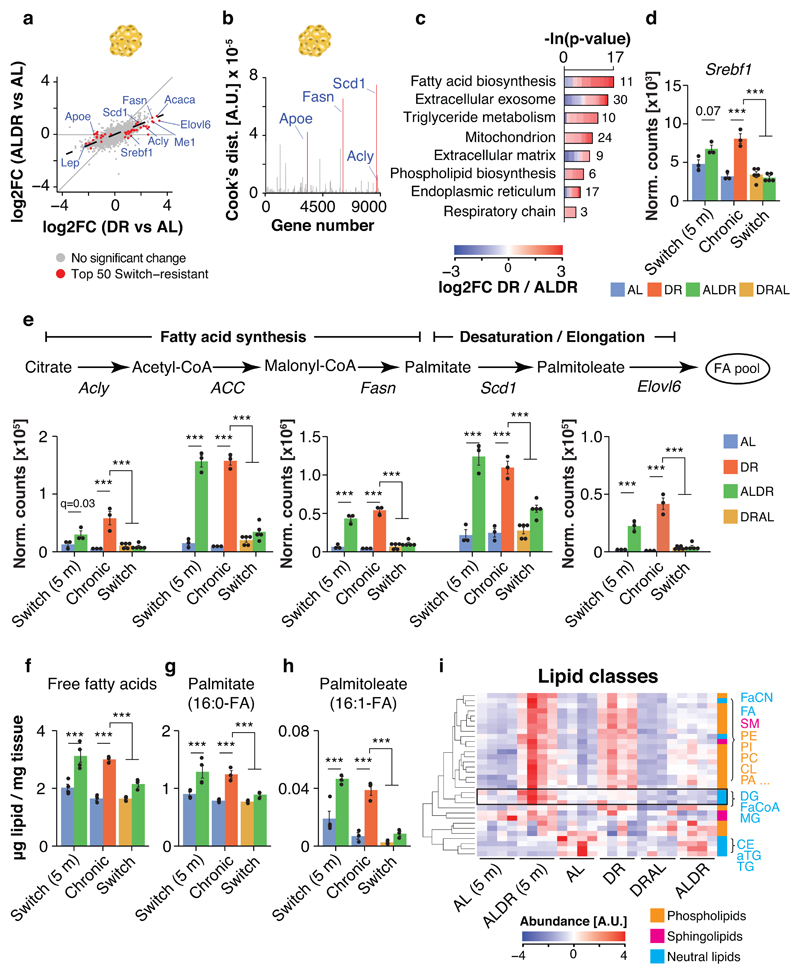
In order to find putatively causal mediators of the transcriptional memory in the WAT, we plotted for each gene the log2-fold expression change in response to chronic or late-onset DR relative to chronic AL and ranked each gene’s influence on the resulting linear fit. The 50 switch-resistant genes with the highest influence (Cook’s distance; Fig. 5a,b) were enriched primarily for lipid metabolism, including fatty acid (FA) biosynthesis, triglyceride (TG) metabolism and phospholipid biosynthesis (Fig. 5c). They included the key lipogenic transcription factor Srebf1 34 and several of its corresponding downstream targets (Fig. 5d,e), Acly, ACC, Fasn, Scd1 and Elovl6, which code for key enzymes in FA synthesis, desaturation and elongation 34. Their expression was strongly up-regulated (some more than ten-fold, (Fig. 5e and and4g)4g) in chronic DR and in young ALDR mice, but they remained largely refractory to the ALDR switch at old age.
a, Scatterplots depicting the expression change for each gene under DR or ALDR feeding (relative to AL) in WAT. The top 50 switch-resistant genes are highlighted in red. b, Gene-wise Cook’s distances from weighted linear regression analysis of expression changes under DR or ALDR feeding (relative to AL) in WAT. c, GO enrichment of the top 50 ALDR switch-resistant genes. Cells indicate gene-wise log2-foldchanges (log2FC) between DR and ALDR fed mice. Lengths of bars represent negative ln-transformed p-values using two-sided Fisher’s exact test. d, Srebf1 mRNA expression (RNA-seq). e, mRNA expression (RNA-seq) of key de-novo fatty acid synthesis genes in WAT. Two-sided Wald test, adjusted for multiple testing. f-h, Abundance of f the total pool of free fatty acids, g, Palmitate and h, Palmitoleate in WAT. One-way ANOVA followed by two-sided post-hoc Tukey test. i, Heatmap of unsupervised clustering of abundance changes for measured lipid classes in WAT; color bar represents z-score range. Black box highlights lipids with induction specifically in young ALDR mice. Biologically independent animals used for RNA-seq: n=3 (AL, DR, ALDR, AL 5m) n=5 (ALDR, DRAL). The RNA-seq experiment has been done once. Biologically independent animals used for Lipidomics: n=4 per diet. Means ± SEM, *** q<0.0001.
We next explored the metabolic consequences of these changes in gene expression, by full liquid chromatography–tandem mass spectrometry (LC-MS/MS) profiling of the WAT lipidome. This allowed quantification of 516 lipid species and 32 different classes with a dynamic range of ~5x10⁷, including the major neutral lipid, (lyso-)phospholipid and sphingolipid classes 35. Our dataset thus permitted a global and unbiased analysis of cellular lipid dynamics (Supplementary Table 5). Consistent with transcriptional up-regulation of de-novo lipogenesis, we detected elevated levels of free FAs in chronic DR and young ALDR mice, including intermediate metabolites of FA synthesis, palmitate and palmitoelate (Fig. 5f-h). In contrast, late-onset DR did not cause a similar increase in FAs, while DRAL mice had FA levels lowered to those of chronic AL controls. These results suggest imperfect activation of lipogenesis as a direct consequence of the transcriptional memory in the WAT of old ALDR mice.
Chronic DR causes white adipose tissue autonomous reprogramming of phospholipid synthesis
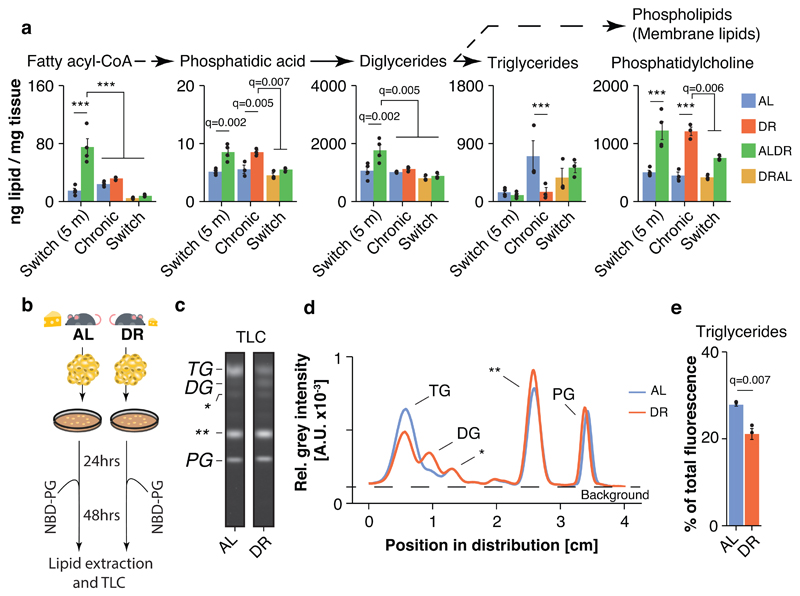
To better understand the possible functions of newly synthesized FAs in the WAT of DR fed mice, we conducted unsupervised hierarchical clustering of all measured lipid classes. Free FAs clustered closely with several phospholipid classes (Fig. 5i), such as phosphatidic acid (PA), phosphatidylethanolamine (PE) and phosphatidylcholine (PC), which were all elevated in chronic DR fed mice (Fig.s 5i and and6a).6a). Levels of neutral TGs, however, were markedly reduced (Fig.s 5i and and6a).6a). In addition, fatty acyl-CoA and diglycerides, which mark the transition between FA synthesis and biogenesis of complex lipid structures 36, showed a strong peak in young ALDR mice only (Fig.s 5i and and6a).6a). Consistent with the major transcriptional reprogramming, DR thus instigated broad-spectrum changes in the WAT lipidome. In agreement with previous studies 23, DR fed mice appeared to use newly synthesized FAs to build various types of membrane lipids, and this process remained refractory to the ALDR switch at old age.
a, Abundance of lipid classes involved in synthesis of complex lipid molecules as measured in WAT; n=4 biologically independent animals per diet. One-way ANOVA followed by two-sided post-hoc Tukey test. Triglycerides were extracted separately and absolute lipidome values cannot directly be compared to other lipid classes. b, Schematic representation of the WAT explant culture experiment. The experiment was done once with n=3 biologically independent, 24 months old animals per diet. Each isolated WAT depot was equally distributed across three wells and incubated with NBD-PG and transfectant (n=2 technical replicates) or transfectant only (n=1 negative control) c, Representative cellular uptake profiles of exogenously supplied NBD-PG explant-cultured adipocytes. Lipids were separated by TLC and analyzed by fluorescence scanning. Lipid species with low polarity run on top. Standard phospholipids allowed the identification of lipid spots representing triglyceride (TG), diglyceride (DG) and PG levels (the asterisks indicate unidentified lipid species). Full TLC scan and analysis details are presented in Extended Data Fig. 8. d, Relative fluorescence intensity profile in AL- and DR-derived explant cultures (biological replicates n=3; technical replicates n=2; the asterisks indicate unidentified lipid species). e, Relative fluorescent signal in the TG band. n=3 biologically independent, 24 months old animals per diet; technical replicates were averaged prior analysis. Two-sided t test.
Means ± SEM, *** q<0.0001.
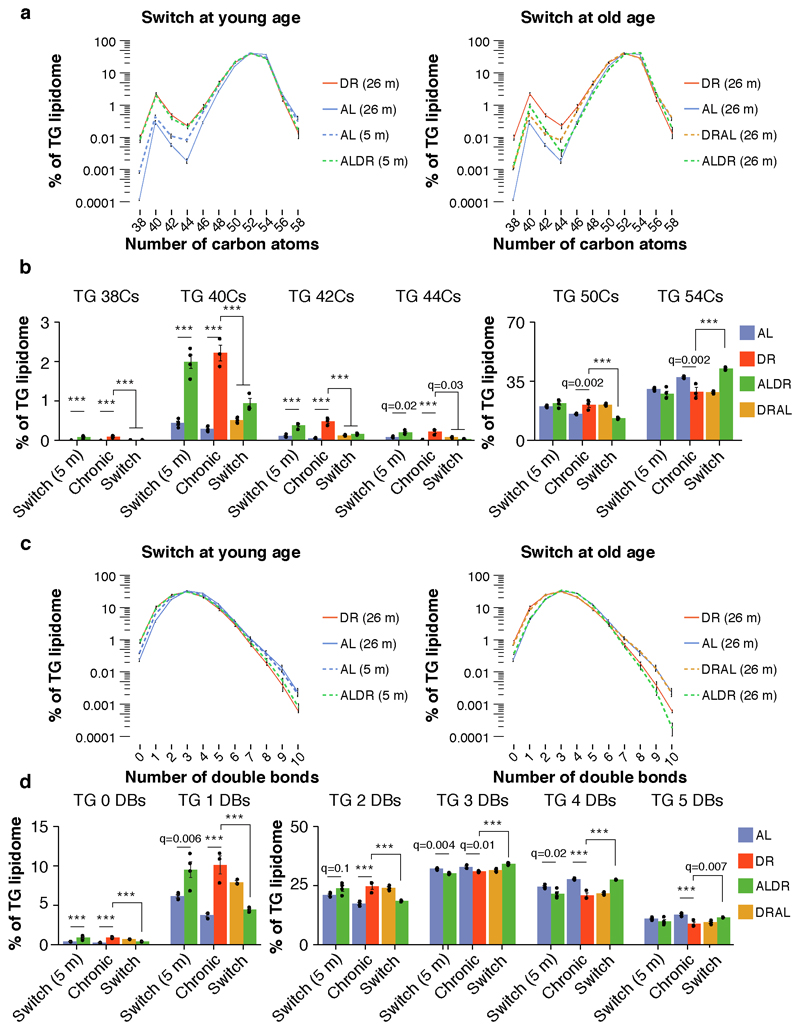
Consistent with the shift towards phospholipid synthesis, levels of neutral TGs were markedly reduced (Fig.s 5i and and6a).6a). Notwithstanding, we assumed that at least a fraction of newly synthesized FAs would also be incorporated into TGs. Given that rapid de-novo synthesis results in generally shorter and less saturated FAs, we thus analyzed the relative TG profile for global shifts in elongation and desaturation. Indeed, chronic and short-term DR at young age decreased the chain length of TG-associated fatty acids, a shift not observed under late-onset DR (Extended Data Fig. 7a,b). Similarly, the relative fraction of saturated and mono-unsaturated TGs was elevated in young ALDR and chronic DR fed animals, but not in old ALDR mice (Extended Data Fig. 7c,d). The molecular composition of TGs in the WAT thus further supported highly active lipogenesis under chronic but not late-onset DR.
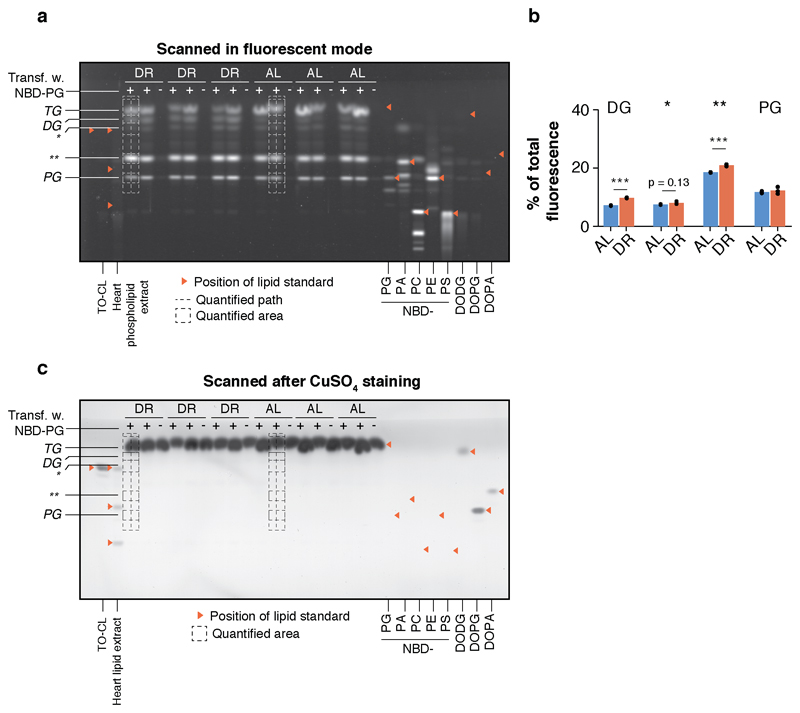
To experimentally verify that the observed phospholipid profiles were a consequence of tissue-specific changes in lipid utilization and not confounded by lipid import from other tissues (such as the liver), we conducted an ex-vivo pulse-chase experiment (Fig. 6b). To this end, we employed highly water-soluble phosphatidylglycerol (PG) with fluorophor-labeled fatty acyl groups (NBD-PG), which, in contrast to most lipid classes, is readily taken up and used by mammalian cells in culture 37. Adipose tissue explants from freshly isolated WAT of chronically DR and AL fed 24-month-old mice from an independent cohort were seeded for 24 hours, before incubating the tissue cultures with NBD-PG and a transfection agent for 48 hours. Subsequent lipid extraction and thin-layer chromatography (TLC) visualized the distribution of fluorescent fatty acyl groups among several lipid classes, representing new lipid molecules that were synthesized by turnover of NBD-PG (Fig. 6b,c and Extended Data Fig. 8a,b).
Lipid extracts of both DR- and AL-derived adipocytes showed a clear and equally strong fluorescent PG band, indicating potent cellular uptake of NBD-PG, and the specificity of the fluorescence was confirmed by tissue cultures incubated without PG (Fig. 6c,d and Extended Data Fig. 8a-c). In agreement with the steady-state lipid levels measured by lipidomics, the fluorescent signal was differentially distributed among the individual lipid classes in a diet-dependent manner, suggesting a global shift in use of lipid mass (Fig. 6d). Indeed, DR-derived adipocytes showed markedly weaker signal in the TG band, indicating reduced breakdown of phospholipids to fuel neutral storage fat synthesis (Fig. 6d,e). Instead, DR-derived samples exhibited significantly increased fluorescence intensity in fractions with higher polarity, especially diglycerides, which run below the TG band (Fig. 6d,e and Extended Data Fig. 3a,b). Unidentified lipid fractions with even higher polarity (which can include fatty acids and membrane lipids), were also significantly increased under DR. Thus, DR-fed mice rewired the lipid flux in WAT autonomously so that TG synthesis was reduced while diglycerides and membrane lipids were increasingly built up.
Cardiolipin metabolism links lipogenesis with mitochondrial biogenesis under late onset DR
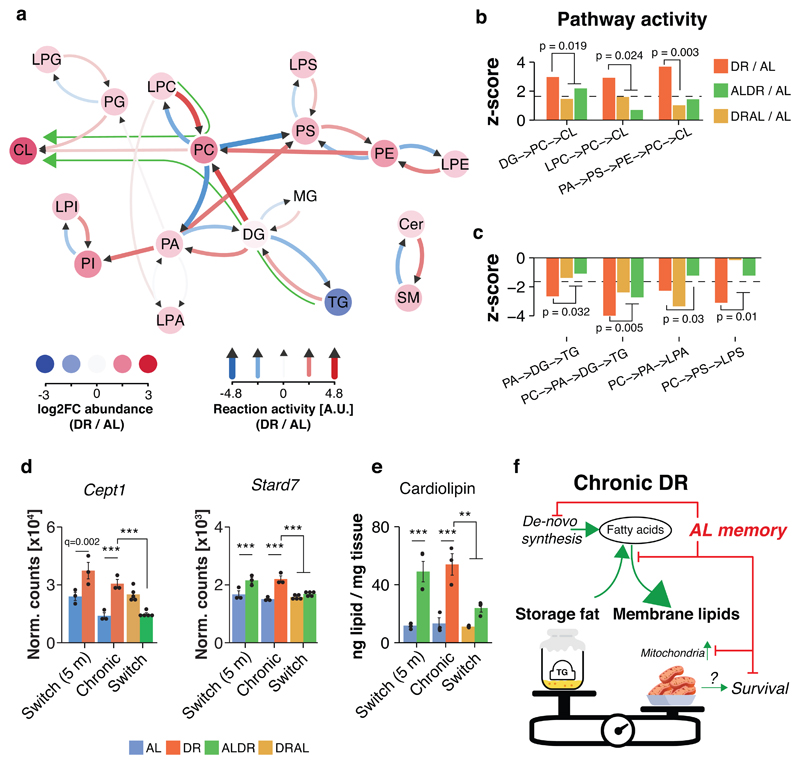
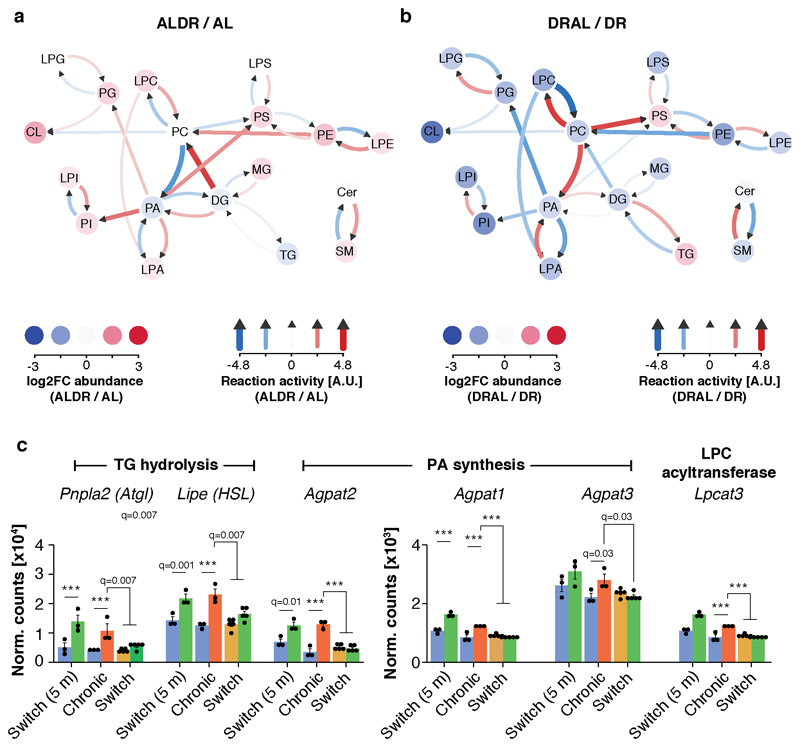
Finally, we determined whether specific membrane lipids were affected by the restructuring of the lipidome in WAT of chronic DR mice. We employed a novel lipid reaction analysis approach 38 to gauge the activity of whole pathways based on steady-state metabolite levels measured by lipidomics. Strikingly, chronic DR, but not late-onset DR, caused widespread reprogramming of almost the entire lipidome to promote the synthesis of phospholipids, especially PC and cardiolipin (CL) (Fig. 7a,b and Extended Data Fig. 9a,b). Simultaneously, pathways that degrade membrane lipids or convert them to triglycerides were significantly less active (Fig. 7c). This shift in lipid use from storage fat to phospholipids is concurs with results from the ex-vivo experiment (compare Fig. 6c,d), which validates our pathway analysis. Switch-resistant expression patterns of key genes involved in TG lipolysis (Atgl, HSL 39,40), PA and PC synthesis (Agpat1-3, Chpt1 36,41) and re-acetylation of lyso-phospholipids (Lpcat3, 41), were in line with the predicted pathway activity (Fig. 7d and Extended Data Fig. 9c). The transcriptional memory of prior AL feeding was thus paralleled by a metabolic memory. In contrast, metabolic consequences of long-term DR were rapidly reversed when DR mice were switched back to AL feeding (Fig. 7b,c and Extended Data Fig. 8b,c).
a, Analysis of lipid pathway activity in WAT of DR fed mice relative to AL control. Red and blue arrows show reactions with positive and negative activity, respectively. Colored circles indicate relative log2-transformed abundance of lipid classes. Green arrows indicate the major predicted lipid flux across the network. b, Active and c, inactive pathways under DR and switch diets relative to AL control (dashed line indicates significance threshold). One-sided t tests (forward or reverse reaction) were used to calculate p values before z transformation. P values above bar graph indicates significance for same pathway relative to DR. Pathway activity was predicted based on lipidomics data with n=4 biologically independent animals per diet. d, mRNA expression (RNA-seq) of key genes in PC synthesis (Cept1) and transport (Stard7), which map to differentially active pathways. Two-sided Wald test, adjusted for multiple testing. e, Cardiolipin levels in WAT of chronic or switch diet fed mice (lipidomics). One-way ANOVA followed by two-sided post-hoc Tukey test. (F) Schematic representation of the reprogrammed transcriptome and lipidome in the WAT of chronically DR fed mice. Processes with impaired activation as a result of prior AL feeding are indicated. Biologically independent animals used: RNA-seq: n=3 (AL, DR, ALDR, AL 5m) n=5 (ALDR, DRAL); Lipidomics: n=4 per diet. Means ± SEM, *** q<0.0001, ** q<0.01.
CL is usually synthesized from PG and is almost exclusively located in the membranes of mitochondria 35. Interestingly, CL levels showed a four-fold induction in chronic DR and in young ALDR fed mice, the strongest increase of all lipid classes (Fig. 7e), although findings from both the ex-vivo experiment and network analysis indicated no significant differences in CL synthesis from PG (Fig.s 7a,c and Extended Data Fig. 7b). Instead, lipid pathway analysis suggested that CL levels became increasingly dependent on PC under chronic DR feeding. CL levels are proportional to mitochondrial mass, which depends on phospholipid supply to the organelle, including trafficking of PC 42–44. PC is the most abundant lipid species in mitochondria 35 and must be imported from the endoplasmic reticulum (ER) via its exclusive transport protein StarD7 44–46, which we also identified as a switch-resistant gene (Fig. 7d), suggesting impaired PC synthesis and transport from the ER to mitochondria. Our results therefore link DR-related mitochondrial biogenesis in the WAT (Fig. 4) with increased synthesis of membrane lipids, which would be required during the expansion of mitochondrial mass (Fig. 7f). In this model, the strong transcriptional memory of past AL feeding for lipogenesis, membrane lipid remodeling and downstream cardiolipin synthesis would pose a bottleneck for mitochondrial biogenesis (Fig. 7f).
In summary, we demonstrated a strong dependence of age-specific mortality on past AL feeding, paralleled by strongly age-related changes in preadipocytes and formation of a strong gene expression and metabolic memory in adipose tissues, which impeded the coordinated reprogramming of lipid metabolism and mitochondrial activity under late-onset DR. Long-term DR fed mice, however, retained only a weak memory of past nutrition and responded acutely to changes in diet.
Discussion
Potential DR-related therapies applicable for humans would ideally function in the elderly, too, as they experience the greatest burdens of age-related metabolic pathologies, including type 2 diabetes 5. Furthermore, it is important to understand if over-nutrition in early adulthood can be completely overcome by subsequent diet. We have therefore performed a systematic assessment of prior diet effects on mortality, tissue-specific gene expression and lipidome dynamics in young and old mice.
Previous studies of late-onset DR have yielded inconclusive results. Onset of DR at 17 or 24 months was first reported to have no or even a worsening effect on survivorship of male, single-housed mice in a three month follow-up period 9. However, this study instigated DR without an adaptation period, monitored survival only over a period of 90 days and did not specify the switch cohort size. A further study of group-housed male mice suggested strong improvement of survival when DR was initiated at 19 months, before mice of the control cohort started to die 10. However, the absence of a chronic DR control precluded any conclusion about the completeness of the survival effect relative to chronic DR. Neither study employed cohort sizes appropriate for profiling of age-specific mortality, and therefore could not probe for acute effects due to the cumulative nature of survival data.
We have investigated the consequences of late-life diet changes with large cohorts of control and switch diet groups, and followed all animals until death. We chose the switch time point a priori, based on statistical power and the cohorts’ mortality. However, even with this large group of mice, conclusions on age-specific mortality are reliable only in the first six to nine months post-switch, before too few AL mice were left for statistically valid comparisons. We further recognize that, due to the comparatively small number of weighed animals, the statistically significant association between weight loss and survival in the ALDR cohort is predominantly driven by a few mice. Even though these few low-responders showed no evidence of being sick, exhibited average weights at the beginning of the switch, and were present among all cohorts, a larger and more targeted study will be necessary to assess our initial observation. Nevertheless, the robustness of our findings is supported by consistent results across breeding cohorts, with lifespans of AL and DR mice showing statistically insignificant differences. We saw a significant response of mortality to the ALDR switch only in Cohort 2. Such batch-specific variation has also been seen in the response of mouse lifespans to rapamycin 47.
Our study demonstrates that long-term DR can lead to a partial, lasting protective effect when returning to full feeding, as the mortality of late-onset AL mice remained below that of chronic AL-fed mice. A similar, albeit weaker, protective effect was observed for female flies, and the magnitude of the effect increased with the duration of prior DR feeding 6. This suggests an evolutionarily conserved function of long-term DR, which may have implications for humans too. A chronically maintained, healthy lifestyle may thus confer some benefits even when changing nutritional behavior late in life. However, our results also demonstrate that many health benefits of DR can be lost upon returning to full feeding. Furthermore, profiling of liver, BAT and WAT implied that the lasting benefits are unrelated to the effects of DR on metabolic health, as these were acutely reversed to the level of chronically AL-fed mice. Our findings thus suggest that other mechanism or tissues mediate the long-term protective effect of DR. For example, DR reduces the occurrence of neoplasia across tissues 48,49, and delayed cancer onset may thus keep mortality lowered after refeeding, as fatal tumors would require time to develop.
There may be multiple, non-mutually exclusive explanations of the refractoriness to the mortality of old mice to newly imposed DR, including accumulation of damage to DNA and genomic instability, senescent cells and irreversible pathologies. We have identified an adipose-tissue transcriptional and metabolic memory that impedes metabolic reprogramming under DR and that could thus limit the mice’s capacity to reduce mortality. This phenomenon appears to be independent from genomic context, as we observed switch-resistant genes coding for mitochondrial processes in BAT and WAT yet regulated in opposite directions. In contrast to adipose tissues, and in agreement with previous studies 10, the hepatic transcriptome retained plasticity to respond to dietary changes at late age. Tissue-independent mechanisms could be involved in formation of the metabolic memory. For instance, DR remodels the gut microbiome, which causally contributes to metabolic reprogramming in liver and WAT 50,51. Loss of DR-essential microbiome species during ageing under AL feeding could thus render mice refractory to late-onset DR.
As another candidate, tissue-specific mechanism, we discovered major transcriptional shifts in WAT preadipocytes of old AL fed mice, suggesting that stem cell/precursor exhaustion contributes to the WAT memory. This is interesting, since tissue-resident stem/progenitor cells show differing transcriptome shifts during ageing, with e.g. neuronal stem cells exhibiting little intrinsic expression shifts compared to hematopoietic stem cells 52,53. Given that pre-adipocyte differentiation is strongly influenced by immune-derived factors and chemokines 54–56, the increased inflammatory signature and lowered growth factor secretion could indicate a compromised differentiation potential and thus loss of transcriptional flexibility during ageing. While we only had access to scRNA-seq profiles of AL fed mice, the switch-resistant repression of inflammatory genes under DR (such as interferon response genes) could, in this model, represent a way of maintaining plasticity in the adipose tissue through prevention of sterile inflammation. Interestingly, the WAT of AL fed mice exhibits – prior to any other tissue – major age-related expression shifts, most notably of inflammatory genes, at 15 months of age 57. It is noteworthy that ex-vivo WAT explant cultures from DR fed mice still retained clear differences in TG and membrane lipogenesis after 72 hours under full medium conditions and without exposure to the systemic DR environment, thus supporting role of tissue/cell type-specific effects as mediators of the transcriptional memory.
We found that the impaired transcriptional activation of key mitochondrial and lipid metabolism pathways under late-onset DR accurately predicted compromised mitochondrial biogenesis, de-novo lipogenesis and phospholipid dynamics in the WAT. Taking advantage of our extensive lipidomics data set and published pathway databases, we successfully applied a novel reaction dynamics analysis 38, yielding ex-vivo-validated predictions based on measurements of steady-state levels at just a single time point. Considering that lipogenesis is strongly down-regulated in the liver of DR fed mice 22, and that TGs in the WAT contain FAs with shorter chain length and low desaturation state – an indicator of rapidly de-novo synthesized FAs – the switch-resistant lipid dynamics are likely a result of tissue-autonomous changes. Consistent with our findings, DR is known to promote lipogenesis in the WAT 23,58 and to increase mitochondrial biogenesis 3. Whilst mitochondrial biogenesis after four weeks of DR was shown to promote non-shivering thermogenesis in WAT 3, we found no evidence for UCP1-mediated thermogenic activity in 2- or 22-months treated DR mice, suggesting this to be a transient phenotype or dependent on environmental/husbandry conditions. We also found no evidence for thermogenic activity through UCP1-indendent mechanisms such as Ca2+ or creatine cycling 32,33. Noteworthy, rodents, monkeys and humans show reduced core body temperature in response to long-term DR 59, suggesting lowered thermogenic activity under DR. Consistently, we observed evidence for “whitening” of the BAT in the lifelong DR group in our RNA-seq data set, with down-regulation of mitochondrial genes including UCP1, suggesting decreased mitochondria-dependent thermogenesis in the BAT of DR fed mice. DR-induced whitening of BAT has previously been shown in a rat model of type 2 diabetes 60, but was not seen in a recent study of male, single-housed mice 61. This might reflect gender differences in the response of the BAT to DR 62 or could be caused by different husbandry conditions. In contrast to single-housed animals, group-housed DR mice may be able to reduce energy-demanding thermogenesis in the BAT by behavioral adaptation, e.g. increased huddling. Notwithstanding, we cannot preclude altered activity of yet unknown thermogenic processes, and thus future studies should assess thermogenic capacity on a functional level by measuring respiration of adipose tissue directly. Our analysis further suggests a novel role for WAT-specific synthesis of new FAs in order to provide membrane lipids such as PC and CL during expansion of mitochondrial biomass. However, we cannot exclude that low lipogenesis in ALDR mice is a reaction to impaired mitochondrial biogenesis in order to prevent an overflow of lipids due to low beta-oxidation capacity. Also, newly synthesized fatty acids themselves might have additional roles. The fatty acid palmitoleate, for example, which was strongly induced under DR but not late-onset DR, is secreted from the WAT and can act as a bioactive lipokine to remodel metabolism in liver and muscle 63.
In agreement with our model, cold-induced browning of WAT, which also increases mitochondrial expansion, reduces TG abundance and leads to elevated levels of free FAs, PC and CL 64. Moreover, synthesis of CL is essential for mitochondrial biogenesis during cold-exposure 65. Finally, whole-body deletion of the lipogenic transcription factor Srebf1c abrogates lipogenesis and mitochondrial biogenesis in the WAT of DR fed mice, thus strongly implicating Srebf1-driven lipid synthesis in adipose tissue as a limiting element for mitochondrial dynamics and, potentially, essential for improved survival under DR 58. In line with this hypothesis, fat body-specific induction of mitochondrial biogenesis by the Pgc1α homologue spargel is sufficient to extend lifespan in Drosophila 66. Given the important endocrine role of the adipose tissue 67, DR-related remodeling of the WAT may lead to differential secretion of critical endocrine signals that coordinate the systemic response to DR. It will thus be a key task for the future to assess the dependence of reduced mortality under DR on lipogenesis and or mitochondrial biogenesis in the WAT specifically. This could lead to new strategies to maintain the effectiveness of DR when applied late-onset, or even partially replicate the physiological benefits of reduced food intake under unrestricted feeding.
Methods
Mouse husbandry and DR protocol
The DR study was performed in accordance with the recommendations and guidelines of the Federation of the European Laboratory Animal Science Association (FELASA), with all protocols approved by the Landesamt für Natur, Umwelt und Verbraucherschutz, Nordrhein-Westfalen, Germany (reference numbers: 8.87-50.10.37.09.176 and 84-02.04.2015.A437) (Reporting Summary). Female F1 hybrid mice (C3B6F1) were generated in-house by crossing C3H/HeOuJ females with C57BL/6NCrl males (strain codes: 626 and 027, respectively, Charles River Laboratories). Experimental animals were generated in three breeding batches with 300, 280 and 220 animals in breeding round F1, F2 and F3, respectively (Reporting Summary). Lifespans of chronic DR and AL mice from the F1 breeding round were previously published 22. Litter size was adjusted to a maximum of eight pups by removing male pups within 3 days of birth. Pups were weaned at three to four weeks of age and were randomly assigned to cages upon weaning (Reporting Summary). Animals were housed in groups of five females in individually ventilated cages under specific-pathogen-free conditions with constant temperature (21°C), 50-60% humidity and a 12-hour light/dark cycle. For environmental enrichment, mice had constant access to nesting material and chew sticks. All mice received commercially available rodent chow (ssniff R/M-H autoclavable, ssniff Spezialdiäten GmbH, Soest, Germany) and were provided with acidified water ad libitum. Food consumption of the AL group was measured weekly and DR animals received 60% of the food amount consumed by AL animals. To avoid developmental effects, chronic DR treatment was started at 12 weeks of age. Late-life ALDR and DRAL diet switches were introduced when 20% of AL animals of the respective control cohort had died, corresponding to ~24 months of age. DR was introduced stepwise, by reducing the food delivered by 10% per week over four consecutive weeks. DR animals were fed once per day and all animals were checked daily for their wellbeing and any deaths. 15 animals per cohort (three cages) were weighed weekly (up to the age of six months) then monthly (six to 23 months) and again weekly following the diet switch. Ten mice per diet group of the F3 cohort were sacrificed at the ages of 5 and 27 months, corresponding to 2 months (short-term) and 24 months (long-term) DR treatment. All mice were killed within a period of three hours prior to the regular feeding time of the DR mice. Mice were killed by cervical dislocation and tissues were rapidly collected and snap-frozen using liquid nitrogen.
Post switch lifespan and mortality analysis
Animals that died before the diet switch were eliminated from the mortality analysis. Cox regression of post-switch survival curves was performed using custom RStudio (https://www.rstudio.com/) scripts and the following packages: survival, survminer and flexsurv (Reporting Summary). Survival data were modeled with two factors, diet and breeding cohort (~ diet + cohort; diet factor levels: AL, DR, ALDR, DRAL; cohort factor levels: F1, F2, F3). Schoenfeld residuals were analyzed to confirm that the data underlying the Cox regression in Fig. 1C met the proportionality assumption. Contrasts were used to compare the hazard ratios between ALDR relative to AL and between DRAL relative to DR (ALDRAL and DRALDR; ‘Switch vs past diet’). We repeated the analysis with altered contrasts to analyze the hazard ratio difference between ALDR relative to DR and the DRAL relative to AL (ALDRDR and DRALAL; ‘Switch vs new diet’). In order to directly compare the effects of each diet switch relative to their previous diet, we further introduced a contrast to subtract the hazard ratios of ALDRAL from DRALDR (‘Hazard ratio difference’; Fig. 1G).
Analyses were repeated for each cohort separately, for which the ‘cohort’ factor was omitted. To determine if the results of the cohort-wise Cox regression could be accounted for by the larger cohorts of animals under DR and DRAL feeding, which could alone have produced more significant differences for comparisons involving those groups, we repeated each analysis 1000 times while randomly down-sampling the DR and DRAL groups to match the number of AL- and ADLR-fed mice. The resulting distributions of p-values for each analysis were plotted as boxplots (Extended Data Fig. 1C).
To test for acute effects of either switch diet, we performed Cox regression for the first two months post-switch, censoring all mice that were still alive at the end of that period. We repeated the Cox regression and iteratively extended the analyzed time interval by one month. P-values and hazard ratios for ALDRAL, DRALDR and the hazard ratio difference were recorded for each iteration (Fig. 1d,g).
Visualizing age specific mortality rate
Events of death were summarized in bins of 10 days. Mortality (μx) was estimated as μx = -ln (px), where px is the probability of an individual alive at age x-1 surviving to age x. Data for Fig. 1e,f were smoothed by averaging μx over 3 10-day bins. Mortality trajectories were truncated when n < 40 AL fed mice (equivalent to 25% survival).
Calculating rate of weight change
We monitored the weight of 15 mice per diet group and breeding cohort. We used generalized additive modeling to determine the inflection point of the weight gain/loss curve, which we found at day 889 (equivalent to ~ 145 days on new diet). Rate of weight change for each animal was estimated by linear regression over the weight trajectory for this interval. We thereby limited the analysis to the interval before the trajectories plateaued.
In order to compare the weight increase between chronic and late-onset AL mice, we performed linear modeling of the weight change in young chronic AL fed mice, starting at the same average body weight as the DRAL cohort. To allow comparability, we analysed only the period until the AL fed mice reached the same weight as DRAL animals at the inflection point.
Analysis of food intake quantification
Average food intake of chronic or late-onset AL fed mice was monitored through food consumption per cage. In order to normalize food consumption to body weight, we estimated the average body weight from the weighing group.
RNA sequencing and analysis
We isolated RNA from liver, BAT and epididymal white adipose tissue (WAT) of AL, DR, ALDR and DRAL female mice at old age (27 months), as well as AL and ALDR female mice at young age (5 months). For liver tissue, we profiled the transcriptome of three biological replicates per treatment/age group. For BAT, we profiled three biological replicates per treatment/age group, with two extra replicates for old ALDR mice. In case of WAT, we profiled three biological replicates per treatment/age group, with two extra replicates for old ALDR and DRAL mice from the same cohort (three to five). RNA was isolated using Trizol Reagent (Thermo Fisher Scientific, Germany) according to the manufacturer’s protocol before treating samples with DNAse using the TURBO DNA-free Kit (Thermo Fisher Scientific, Germany). RNA quality was measured using the Agilent TapeStation System (Agilent Technologies, Germany). RNA-seq library preparation and sequencing were performed by the Max Planck-Genome-Centre Cologne, Germany (http://mpgc.mpipz.mpg.de/home/). According to the facility’s procedure, stranded TruSeq RNA-seq libraries were prepared as described in 68, using 3 μg of rRNA-depleted RNA as input for liver and WAT, and 1 μg polyA-enriched RNA for BAT. Multiplexed libraries were sequenced with 2x40 mio, 100 bp paired-end reads on an Illumina HiSeq2500 (Illumina, San Diego, California, USA) liver and WAT, and 1x25 mio, 150bp reads for BAT. Liver RNA-seq data for young ALDR, young AL, old DR and old AL-fed mice were previously published 22 and are publicly available under the Gene expression omnibus (GEO) ID {"type":"entrez-geo","attrs":{"text":"GSE92486","term_id":"92486"}}GSE92486. Liver RNA-seq data for old ALDR and DRAL-fed mice and RNA-seq data from BAT and WAT are available under GEO ID {"type":"entrez-geo","attrs":{"text":"GSE124772","term_id":"124772"}}GSE124772.
Raw sequence reads were trimmed to remove adaptor contamination and poor-quality reads using Trim Galore! (v0.3.7, parameters: --paired --length 25). Trimmed sequences were aligned using Tophat2 69 (v2.0.14, parameters: --no-mixed --library-type=fr-firststrand -g 2 -p 15 -r 500 --mate-std-dev 525). Multi-mapped reads were filtered. Data visualization and analysis were performed using SeqMonk (http://www.bioinformatics.babraham.ac.uk/projects/seqmonk/), custom RStudio (https://www.rstudio.com/) scripts and the following Bioconductor packages: Deseq2 70, topGO 71 and org.Mm.eg.db (Reporting Summary). To account for tissue-specific expression, we defined all genes with an FPKM of > 2 in at least half of all samples as ‘expressed’. Unless stated otherwise, the set of expressed genes was used as background for all functional enrichment analyses involving expression data. P-values were adjusted for multiple testing.
To identify global expression changes for genes associated with mitochondria, we retrieved the list of genes associated with the gene ontology term ‘mitochondrion’ (GO:0005739) and plotted the log2 fold changes for each diet group as opposed to the chronic, old, AL diet group.
Single cell RNA sequencing analysis
Pre-processed and annotated scRNA-seq data (FACS followed by Smart-seq2 protocol) from gonadal adipose tissue (3 and 24 months old) were obtained from the Tabula Muris Senis consortium 28. Given the lack of data from aged female mice, we focused our analyses on samples derived from male mice. Additionally, cells with less than 200 or more than 6,500 genes were excluded. This yielded 1,962 high quality cell transcriptomes derived from four young and four old biological replicates. Data visualization and analysis were performed using custom Rstudio scripts and the following Bioconductor packages: Seurat (version 3) 72 and topGO (Reporting Summary). Data normalization, scaling and identification of variable genes was performed using Seurat’s built-in vst method with 2000 features to select. A shared-nearest-neighbors graph was constructed using the first 10 PC dimension before clustering cells using Seurat’s built-in FindClusters function with a resolution of 0.4 and default parameters. Annotations for preadipocytes were adopted from the Tabula Muris Senis consortium (referred by the consortium as ‘mesenchymal stem cell of adipose’). Differentially expressed genes between young and old preadipocytes were identified using Seurat’s FindMarkers function (parameters: only.pos=F min.pct=0.01 thresh.use=0.01, test=’MAST’). In order to compare the expression changes observed on the single cell level with mRNA patterns on the tissue level, functional enrichment analysis was run with the set of WAT bulk RNA-seq expressed genes as background.
To test for a potential association between gene expression changes measured in aged preadipocytes and in WAT of DR fed mice, we considered only genes changing significantly in both datasets. We plotted log2-fold expression changes during pre-adipocyte ageing versus expression changes on the tissue level under DR, and the distribution of genes among the four resulting quadrants was tested for directionality using Fisher’s exact test. ALDR switch-resistant genes that showed a significant inverse association between both datasets were further analyzed for functional enrichment using topGO.
Comparing transcriptional shifts between diet groups
To compare the global transcriptional shifts induced by chronic and late-onset DR, we defined significantly up- or down-regulated genes between chronic DR and AL as a reference set. For each of these genes, expression values were scaled by the root-mean-square (using R’s scale function) across all samples. The resulting distribution for all genes was visualized as boxplots. The expression patterns for ALDR switch-resistant genes in ALDR switch mice were additionally highlighted.
To identify top switch-resisting genes, we performed weighted linear regression by correlating the expression changes across all genes. For each gene, we retrieved and correlated the log2 fold change values from Deseq2 for the comparisons of chronic DR versus chronic AL and late-onset DR versus chronic AL. In addition, we provided the log10-transformed average expression (‘base mean’) for each gene as weight for the linear fit, to compensate for lowly expressed genes having larger log2 fold changes. Genes were ranked according to their Cook’s distance and the top 50 genes that were also classified as ‘switch-resistant’, were selected. Given that both x- and y-axis represent data normalized to the same reference group (i.e. are not independent), the resulting correlation may be estimated incorrectly. Expression levels of selected candidates were therefore verified via Quantitative-Real-Time PCR.
Quantification of RNA Transcripts by Quantitative Real Time PCR
Quantitative Real Time PCR (qRT-PCR) was conducted on tissues that were derived from the same tissue collection group (but not identical mice) as the ones used for RNA-seq. In order to isolate total RNA from WAT for q-RT-PCR analysis, samples were homogenized in Trizol (#15596018, ThermoFisher Scientific), incubated 5min at RT and then centrifuged at full-speed for 10 min at 4°C in a tabletop centrifuge. To avoid carry-over of the resultant fat layer, the Trizol subnatant was carefully transferred to a fresh tube, mixed with 200 μl chloroform (366927-100 ml, Sigma) and incubated for 10min at RT prior to centrifugation at 12.000g for 15min at 4°C. The aqueous RNA-containing phase was transferred to a fresh tube, mixed with 500 μl isopropanol, 50 μl 3 M Sodium acetate and 15 μl GlycoBlue™ Coprecipitant (AM9515, ThermoFisher Scientific) and incubated for 10min at RT followed by centrifugation at 12.000g for 10 min at 4°C. The supernatant was removed and the pellet was washed twice with 500 μl ice-cold 70% ethanol and centrifuged at 7.500g for 5 min at 4°C. Pellets were air-dried for 15min at RT and re-suspended in 50 μl DEPC-treated, autoclaved ddH2O followed by Dnase treatment to remove genomic DNA contaminations using the DNA-free™ DNA Removal Kit (AM1906, Invitrogen). RNA concentrations were measured using the Qubit™ RNA BR Assay Kit ({"type":"entrez-protein","attrs":{"text":"Q10210","term_id":"1723278","term_text":"Q10210"}}Q10210, ThermoFisher Scientific). 1.5 μg of RNA was used for first-strand cDNA synthesis using SuperScript VILO Master Mix (#11755-500, ThermoFisher Scientific) with 120 min incubation at 42°C to increase cDNA yield. Q-RT-PCR analysis was conducted using the Taqman Gene Expression Master mix (#4369106, Applied Biosciences) and the following Taqman probes (ThermoFisher Scientific): Srebf1 (Mm01138344_m1), Acaca (Mm01304257_m1), Elovl6 (Mm00851223_s1), Fasn (Mm00662319_m1), Pol2ri (Mm01176661_g1), UCP1 (Mm01244861_m1). Pipetting was carried out using a Janus Automated Workstation (PerkinElmer). qRT-PCR was done on a QuantStudio 6 Flex Real-Time PCR System (ThermoFisher Scientific) and gene expression was calculated using the 2-ΔΔCT method with Pol2ri expression as internal control and normalized to the respective gene expression level of the AL control group.
Protein purification and western blotting
Protein purification and western blotting were conducted on tissues that were derived from the same tissue collection group (but not identical mice) as the ones used for RNA-seq. For western blot analysis, WAT samples were homogenized in Pierce™ RIPA Lysis and Extraction Buffer buffer (#89900, ThermoFisher Scientific) supplemented with PhosSTOP™ phosphatase inhibitor cocktail (#4906837001, Roche) and cOmplete™, Mini, EDTA-free Protease Inhibitor Cocktail (#11836170001, Roche). Homogenates were incubated for 10 min on ice and then sonicated for 5 min. After centrifugation for 15 min at 4°C full-speed in a table top centrifuge, protein extracts were transferred to fresh tubes and protein concentrations were quantified using the Pierce™ BCA assay (#23225, ThermoFisher Scientific). 25 μg of protein extract per sample was separated on 12% acrylamide gels (#5678044, Criterion™ TGX Stain-Free™ Protein Gel, Biorad) and blotted on PVDF membranes (Immobilon-FL IPFL00010, Merck) for 1 hr at 100V on ice. Membranes were blocked for 1 hr at RT in Odyssey® Blocking Buffer (TBS) (927-50000 LI-COR Biosciences) followed by overnight incubation in the following primary antibodies diluted in Odyssey® Blocking Buffer: NDUFA9 (1:1000, AB_301431, Abcam), mtCO1 (1:1000, AB_2084810, Abcam), α-Tubulin 11H10 (1:1000, AB_2619646, Cell Signaling Technology). Blots were washed four times with TBS 0.2% Tween (TBS-T), incubated with fluorescently labeled secondary antibodies (1:15000, IRDye 680RD, (AB_10956166, LI-COR Biosciences), IRDye 800CW (1:15000, AB_621842, LI-COR Biosciences)) diluted in Odyssey® Blocking Buffer for 1h at RT followed by four washing steps with TBS-T at RT. Image acquisition was done using an Odyssey Infrared Imaging System (LI-COR Biosciences). For the western blot analysis of UCP1, samples were blotted on Amersham™ Hybond® PVDF membranes (GE10600023, Merck), blocked for 1h at RT in 5% non-fat dry milk powder (A0830, 1000 PanReac AppliChem) and washed three times in TBS-T. Membranes were incubated OVN with the following primary antibodies diluted in sterile filtered 5% fatty-acid free bovine serum albumin (BP9704-100, Fisher Scientific) in TBS-T: UCP1 (1:1000, AB_2687530) or α-Tubulin 11H10, (1:1000, AB_2619646) both obtained from Cell Signaling Technology. Blots were washed three times in TBS-T, incubated with anti-rabbit HRP- coupled secondary antibodies (1:10000, AB_2536530, ThermoFisher Scientific) diluted in 5% milk in TBS-T for 1h at RT, followed by three washing steps in TBS-T before incubation in ECL solution (Pierce™ ECL Plus Western Blotting Substrate, 32132, ThermoFisher Scientific) and image acquisition on a ChemiDoc™ XRS+ System (Biorad). After UCP1 image acquisition, blots were stripped in 0.5M sodium hydroxide (S8045-500G, Sigma) for 1h at RT, washed three times in TBS-T before ECL incubation and image acquisition to control for residual UCP1 signal. Blots were washed three times in TBS-T before blocking and incubation in primary α-Tubulin antibody as described before.
Protein bands were quantified using the Fiji software package 73 with α-Tubulin as loading control. Samples were normalized against the respective AL control.
Analysis of mtDNA copy number
mtDNA copy number quantification was conducted on tissues that were derived from the same tissue collection group (but not identical mice) as the ones used for RNA-seq. To analyze mtDNA copy number, total DNA of WAT samples was isolated using the DNA Blood and Tissue kit (69506, Qiagen) with an additional centrifugation step at 200g for 5 min after lysis in ATL buffer. DNA concentrations were quantified using the Qubit dsDNA BR Assay kit ({"type":"entrez-protein","attrs":{"text":"Q32853","term_id":"75280860","term_text":"Q32853"}}Q32853, ThermoFisher Scientific). QPCR was carried out in a QuantStudio 6 Flex Real-Time PCR System (Applied Biosystems) using the Taqman Universal PCR Master Mix (Applied Biosystems). Reactions were run in quadruplicates on 384-well plates using 5 ng of total DNA per reaction. Specific Taqman probes were used to quantify the nuclear 18S gene, (Hs99999901_s1) and the Rnr2 (Mm04260181_s1), Atp6 (Mm03649417_g1) and Cox1 (Mm04225243_g1) genes for mtDNA (ThermoFisher Scientific). Data were analyzed using a standard curve method and relative mtDNA content was calculated by the ratio of mtDNA probes relative to genomic DNA (mtDNA/18S). Results were normalized to the relative mtDNA content of the AL control group.
Lipidome measurement and analysis
Extraction, measurement and quantification of lipids were performed following published protocol 74. Therefore, 50 mg of WAT from the same mice used for RNA-seq measurement were used for lipid extraction (four replicates per age and diet). Tissue pieces were homogenized before lipids were extracted using the Folch method. The lower phase was recovered and resuspended in 150 μl chloroform, while the upper aqueous phase was isolated, dried and resuspended in 100 μl in chloroform/methanol/water (2:5:1, by vol.). Isolated lipids were analyzed by LC/MS/MS using an Orbitrap Elite mass spectrometer (Thermo Fisher Scientific, USA) with both positive and negative electrospray ionization.
The naturally occurring lipids originating from the WAT samples were identified by reference to 80 μl of a standard mixture of synthetic lipids containing C17-acyl groups rather than the even numbers of carbon atoms. This sample of lipid standard contained 17:0-cholesterol ester (CE), 17:1/17:1/17:1-triacylglycerol (TG), 17:1/17:1/17:1-1-alkyltriacylglcerol (aTG), 17:0/18:1-diacylglycerol (DG), 17:0/18:1-alkyldiacylglycerol (aDG), 17:0-monoacylglycerol (MG), 17:0-free fatty acid (FA), 17:0-fatty-acyl coenzyme A (FaCoA), 13:0-fatty-acyl coenzyme A (short-chain FaCoA), 17:0-fatty-acyl carnitine (FaCN), 17:0/18:1-phosphatidic acid (PA), 17:0/18:1-phosphatidylcholine (PC), 17:0/18:1-alkylphosphatidylcholine (aPC), 17:0/18:1-phosphatidylethanolamine (PE), 17:0/18:1-alkylphosphatidylethanolamine (aPE), 17:0/18:1-phosphatidylglycerol (PG), 17:0/20:4-phosphatidylinositol (PI), 17:0/18:1-phosphatidylserine (PS), 14:0/14:0/14:0/14:0-cardiolipin (CL), C17-platelet-activating factor (PAF; 50 ng), C17-2-lysoplatelet-activating factor, 17:0-2-lysophosphatidic acid (LPA), 17:0-2-lysophosphatidylcholine (LPC), 17:0-2-alkyllysophosphatidylcholine (aLPC), 17:1-2-lysophosphatidylethanolamine (LPE), 17:1-2-alkyllysophosphatidylethanolamine (aLPE), 17:12-lysophosphatidylglycerol (LPG), 17:1-2-lysophosphatidylinositol (LPI), 17:1-2-lysophosphatidylserine (LPS), C17-ceramide (Cer), C17-sphingosine-1-phosphate (S1P), C17-sphingomyelin (SM).
Lipid species were normalized to synthetic standards to quantify their absolute abundance. Lipid species of the same class were summarized to quantify abundance levels of the entire lipid class. Abundance differences in individual lipid species or lipid classes were tested by one-way ANOVA followed by a post-hoc Tukey test for pairwise comparisons across all treatment and age groups. For elongation and saturation analysis, TG species with the same number of carbons/double bonds were calculated as percentage of the entire TG lipidome. We conducted one-way ANOVA with post-hoc Tukey HSD for each chain length/saturation to test for significant differences.
White adipose tissue explant culture and lipid transfection
WAT explant cultures were generated from 24 months old female AL and DR mice of an independent cohort. Mice were sacrificed using cervical dislocation and epididymal WAT pads were dissected and placed in explant culture growth medium (Dulbecco’s MEM/Ham’s F12 cell culture medium (FG4815, Merck) containing 1% Penicillin-Streptomycin (5,000 U/mL) (#15070063, ThermoFisher Scientific), 10% Fetal Bovine Serum (#10270106, Gibco), 17 μM D-Pantothenic acid (Sigma, P5155) and 33 μM Biotin (B4639, Sigma). Fat pads were washed once in sterile DPBS (14190-094, ThermoFisher Scientific) and cut into small tissue pieces using a razor blade. Tissue pieces were transferred to a 70 μm MACS SmartStrainer (130-098-462, Miltenyi) and washed with 35 ml DBPS to remove free-floating fat. Excess liquid was removed and tissue explants were transferred to 6-well plates (657160, Greiner Bio-One). Explant cultures were allowed to adhere at RT for 10 min, supplied with pre-warmed 2 ml growth medium and incubated at 37°C 5% CO2 for 24 hrs prior to lipid transfection. Lipid transfections with 18:1-12:0 NBD-PG (1-oleoyl-2-12-[(7-nitro-2-1,3-benzoxadiazol-4-yl)amino]dodecanoyl)-sn-glycero-3-[phospho-rac-(1-glycerol)] (ammonium salt) (#810166C, Avanti Polar Lipids Inc.) were conducted according to manufacturer’s recommendations. Per well, 30 nM NBD-PG in chloroform was evaporated and dissolved in 195μl Opti-MEM™ I Reduced Serum Medium (31985070, Gibco) and sonicated for 15 min in a chilled sonicator water bath to improve solubility. Lipofectamine 3000 (L3000-001, ThermoFisher Scientific) mixtures with 3.75μl Lipofectamine per well were prepared according to manufacturer’s recommendations in Opti-MEM medium. Lipofectamine and NBD-PG were mixed in a 1:1 ratio and incubated for 15 min at RT in the dark. Lipofectamine control or NBD-PG were added drop-wise to the respective well, mixed. Explant cultures were incubated for 48h before samples were snap frozen and stored at -20°C.
Thin layer chromatography of lipids
Extraction of lipids from adipose tissue was performed according to 76 with modifications. WAT explant cultures were homogenized in 500 μl of 255 mM ammonium carbonate by Precellys 24 beads beater (2 x 20 sec 6500 rpm with ceramic beads). 120 μl homogenate was mixed with 900 μl of chloroform/methanol (1:2 (v/v)). After mixing for 30 min, H2O (0.12 ml) was added followed by vortexing. After the addition of 0.3 ml chloroform and 0.3 ml H2O, the sample was mixed again for 10 min, and phase separation was induced by centrifugation (800g, 2 min). The lower chloroform phase was carefully transferred to a clean glass vial. The upper water phase was mixed with 10 μl 1N HCl and 300 μl chloroform and extraction was repeated. After phase separation, the lower chloroform phase was carefully transferred to the glass vial with the chloroform phase from the first extraction. The solvent was evaporated by a gentle stream of argon at 37°C. Lipids were dissolved in 100 μl of chloroform/methanol (1:1 (v/v)). 4 μl of the lipid samples were spotted on a HPTLC plate (Merck Silica gel 60 F254) and developed with chloroform/methanol/water/triethylamine 30:35:7:35 (v/v/v/v). Analysis of fluorescent signals was performed using the Typhoon Trio laser scanner (λem=526nm, λex= 488 nm) and the ImageQuant software (GE Healthcare). TLC plates were stained with 470 mM CuSO4 in 8.5% o-phosphoric acid and subsequently incubated for 10 min at 180°C.
Thin layer chromatography fluorescent signal analysis
Distribution of fluorescent signal was analysed with Fiji 73. First, the distribution and width of each fluorescent band was quantified by vertical paths run through the centre of each lane using ‘integrated density’ as measurement. Since there was no fluorescent signal from cells incubated without NBD-PG, it can be assumed that all the fluorescence in the NBD-transfected cells was originally PG. Thus, the sample-wise relative distribution of fluorescent signal (i.e. relative conversion rate of PG into other lipid species) can be obtained by normalising against the total sum of the integrated signal, thereby removing potential differences in cell number or PG uptake. Data from technical replicates were averaged after quantification. Fluorescent and non-fluorescent lipid standards were run in parallel to identify individual lipid classes and to estimate the influence of the fluorescent label on the retention behaviour of the TLC. TG band was identified as the top most running band after CuSO4 staining and scanning.
Next, the fluorescent signal of each band was measured using the ‘regions of interest’ option in Fiji. For each band (TG, CL, PG, etc.) the selected area was of equal size across all samples. Measured values were normalised against the sample-wise, total fluorescent signal quantified by a bin spanning all bands together. Data from technical replicates were averaged after quantification.
Lipid reaction network analysis
Reaction network analysis was performed as described previously in 38. This method calculates statistical z-scores for all possible lipid pathways in order to predict whether a particular pathway is active or inactive under DR as opposed to AL-fed mice. Reactions with higher z-scores were classified as active. First, we retrieved all publicly annotated reactions and lipid pathways from Reactome 77 to construct a network of reactions. Using the lipidomics dataset, we calculated the molecular concentrations for each lipid species and class, before computing for each reaction the so-called reaction weight (ω) as a ratio of product over substrate. Next, we performed, for each reaction, one-sided t-tests using the weights observed under chronic DR or AL feeding, to identify reactions with differential activity. Resulting p-values were converted to z-scores using the qnorm function (call: qnorm(1 – p-value)) provided by the R package ‘stats’. We chose the significance level (p-value) to be 0.05, corresponding to a z-score Zi > 1.645 for reaction i to be determined as significantly active under DR as opposed to AL. For visualization, we multiplied the z-score with -1 for cases where the reaction was significantly more active under AL as opposed to DR.
Finally, we calculated an average z-score for each possible combination of reactions (i.e. pathways) to detect consistent changes in the flux across multiple reaction steps. With A {A1,A2,…,Ak} being the pathway of interest, where Ai (i=1,2,…,) are metabolites, we calculate the average z-score ZA of the pathway as follows:
Zi represents the z-score for each reaction involved in the pathway. As shown in 38, ZA follows a normal distribution. To determine if a pathway A was significantly active under DR compared to AL-fed mice, we chose the significance level (p-value) to be 0.05, corresponding to a ZA > 1.645. For visualization, we multiplied the ZA with -1 for cases where the pathway was significantly more active under AL as opposed to DR.
We repeated the analysis correspondingly for the ALDR and DRAL groups with AL-fed mice used as reference.
Quantification and statistical analysis
Statistical analysis and sample sizes
RStudio (https://www.rstudio.com/) and Deseq2 70 were used for statistical analysis. Data are expressed as mean ± SEM. P-values were calculated using the following tests: Deseq2’s Wald test (RNA-seq data), Fisher’s exact test (enrichment analysis); Wald and likelihood ratio test (Cox regression); t-test with Pearson’s product-moment correlation (correlation between weight/weight change and age at death); t-test (fluorescent signal intensity), one-sided t-test (lipid reaction network activity); one-way ANOVA followed by a post-hoc Tukey test for pairwise comparisons (if not specified). Quantile-quantile plots were analyzed to confirm that data met assumptions of the statistical approach when t-tests and regression were used. Schoenfeld residuals were analyzed to confirm that the data underlying the Cox regression in Fig. 1C met the proportionality assumption.
P-values less than 0.05 were considered statistically significant with a type II error of β = 0.2. Where multiple testing was performed, the adjusted p-values were used to determine significance. q-values < 0.0001 were marked with ***. When comparing values measured under chronic DR were compared with those observed under DRAL and ALDR, and in both tests the q-values were below 0.05, the larger of the two was indicated in the figure (Reporting Summary).
Extended Data
Extended Data Fig. 1
Body weights for chronic and switch AL cohorts. Solid lines indicate when chronic DR and diet switches were applied. Dashed lines indicate linear fit of weight gain for both cohorts. Slope of linear fits are indicated below. n=45 biologically independent animals per diet. b, Averaged daily food intake per mouse. Each point represents the values from one cohort, encompassing 6 cages each. n=3 cohorts per diet. c, Average daily food uptake for 3- and 5-weeks post-switch, split by cohorts and individual cage. n=6 biologically independent cages per diet and cohort. Two-sided Wilcoxon rank-sum test, adjusted for multiple testing. d, Averaged daily food intake per mouse after normalizing against average body weight. Each point represents the values from one cohort, encompassing 6 cages. n=3 cohorts per diet. Means ± SEM.
Extended Data Fig. 2
a, Pre- and post-switch weight curves for chronic and switch diet mice from the 3 breeding cohorts (± 95% confidence intervals). Solid and dashed lines indicate the time point for diet switch and tissue collection, respectively. Tissues were collected from the F3 cohort only. Number above graph indicates total cohort size at birth. n=15 biologically independent animals per diet and cohort. b, Cohort-specific post-switch Kaplan-Meier survival curves for chronic and switch diet cohorts. Cox regression (dashed line) was used to avoid making assumptions about the shape of the trajectories. c, Cohort-specific distribution of p-values as computed from n=1000 Cox regression analyses with random down-sampling of DRAL and DR cohorts to match the size of AL/ALDR cohorts. Analyses were run relative to the pre- and post-switch control. Dashed line indicates significance threshold. Whiskers represent 1st and 5th quartile, box edges represent 2nd and 4th quartile and centre line represents 3rd quartile/median. Outliers are marked by points. b, c Biologically independent animals per cohort at start of switch: F1: n=58 (AL) n=69 (DR), n=72 (DRAL), n=57 (ALDR); F2: n=55 (AL) n=69 (DR), n=69 (DRAL), n=56 (ALDR); F=3: n=44 (AL) n=52 (DR), n=53 (DRAL), n=44 (ALDR). Means ± SEM.
Extended Data Fig. 3
a, Heatmap of unsupervised clustering of expression changes for ALDR switch-resistant genes in BAT (n = 3-5 per group; color bar represents z-score range). b, Boxplot representation of scaled expression levels of differentially up- and down-regulated genes under chronic DR as opposed to chronic AL controls in liver of ALDR switch mice at young age. Whiskers represent 1st and 5th quartile, box edges represent 2nd and 4th quartile and centre line represents 3rd quartile/median. c-d, Heatmap of expression changes for ALDR switch-resistant genes in c BAT and d WAT of young ALDR switch mice (n = 3 per group; color bar represents z-score range). Biologically independent animals used for RNA-seq: Liver: n=3 (AL, DR, ALDR, DRAL, ALDR 5m, AL 5m); BAT: n=3 (AL, DR, DRAL, AL 5m, ALDR 5m) n=5 (ALDR); WAT: n=3 (AL, DR, ALDR, AL 5m) n=5 (ALDR, DRAL).
Extended Data Fig. 4
a, t-SNE visualization of scRNA-seq data (FACS Smart-seq2) from the GAT stromal-vascular-fraction, split by age. Preadipocytes as annotated by the Tabula Muris Consortium are colored by age. b, Scatterplot representation of average expression levels of genes of young and old preadipocytes. Differentially expressed genes (DEGs) are indicated in blue. c, Representative Gene ontology (GO) enrichment of top 300 differentially expressed genes between old and young preadipocytes. Lengths of bars represent negative ln-transformed p-values using two-sided Fisher’s exact test. d, t-SNE visualisation of scRNA-seq data colored by expression of two regulated genes, Ccl7 and Tgfb3. e, Scatterplot of expression differences between old and young preadipocytes (by scRNA-seq) versus expression differences between DR and AL (by bulk RNA-seq). Number of common DEGs in each quadrant is indicated in blue, ALDR switch-resistant genes are indicated in red. There was a significant inverse association as determined by two-sided Fisher’s exact test for common DEGs (p = 0.0026) and when limiting to ALDR switch-resistant genes (p=0.003). f, Representative GO enrichment of 91 switch-resistant genes following the inverse association in e. Lengths of bars represent negative ln-transformed p-values using two-sided Fisher’s exact test. The complete list of enriched GO terms can be found in Supplementary Table 1. g, Violin plot representing expression of selected genes across all profiled cell types. Points indicate cell-wise expression levels and violin indicates average distribution of expression split by age. h, mRNA expression (RNA-seq) of the same genes WAT. Scd1 expression is shown in Fig. 5. Two-sided Wald test, adjusted for multiple testing. All scRNA-seq data represents cells that were derived and processes from n=4 biologically independent mice per age group, encompassing a total of n=1962 biologically independent cells. Biologically independent animals used for bulk RNA-seq: n=3 (AL, DR, ALDR, AL 5m) n=5 (ALDR, DRAL). Means ± SEM, *** p<0.0001.
Extended Data Fig. 5
Representative GO enrichment of ALDR switch-resistant genes in the liver. Lengths of bars represent negative ln-transformed p-values using two-sided Fisher’s exact test. Biologically independent animals used for RNA-seq: n=3.
Extended Data Fig. 6
a, Distribution of gene-wise expression changes in BAT under chronic DR and switch diets relative to chronic AL feeding for genes associated with the GO term ‘Mitochondrion’. (n = 1299 genes). Whiskers represent 1st and 5th quartile, box edges represent 2nd and 4th quartile and centre line represents 3rd quartile/median. Two-sided Wilcoxon rank-sum test, adjusted for multiple testing. b, mRNA expression (RNA-seq) of thermogenic marker genes in BAT. c, mRNA expression (RNA-seq) of marker for thermogenesis and mitochondrial biogenesis in BAT. d, Apoe mRNA expression (RNA-seq) in BAT. Two-sided Wald test, adjusted for multiple testing. e, Whole LICOR western blot image of Fig.4D. f, Western blot analysis of UCP1 in WAT with α-tubulin as loading control. Tissue extract from one BAT sample (very right lane) was included as positive control for the UCP1 antibody. g-h, mRNA expression (RNA-seq) of uncoupling-independent, thermogenic marker genes in WAT for g creatine cycling and h Ca2+ cycling. Two-sided Wald test, adjusted for multiple testing. i, DRAL switch-resistant genes in WAT. Lengths of bars represent negative ln-transformed p-values using two-sided Fisher’s exact test. The complete list of enriched GO terms can be found in Supplementary Table 4. Biologically independent animals used for RNA-seq: BAT: n=3 (AL, DR, DRAL, AL 5m, ALDR 5m) n=5 (ALDR); WAT: n=3 (AL, DR, ALDR, AL 5m) n=5 (ALDR, DRAL). The Western blot analysis was done once using tissues of n=4 biologically independent animals per diet that were derived from the same cohort but were not identical to the mice used for RNA-seq. Means ± SEM, *** q<0.0001.
Extended Data Fig. 7
a, Distribution of TG species for the switch at young (left) and old (right) age classified according to the number of carbon atoms as proxy for TG-associated fatty acid chain length. Values represent normalized relative abundances (0-100%) on a logarithmic scale. b, Selected TG groups classified according to associated fatty acid chain length. Values are identical to the ones in a. One-way ANOVA followed by two-sided post-hoc Tukey test. c, Distribution of TG species for the switch at (left) young and (right) old age classified according to the number of double bonds in TG-associated fatty acid chains. Values represent normalized relative abundances (0-100%) on a logarithmic scale. d, Selected TG groups classified according to the number of double bonds in associated fatty acids. Values are identical to the ones in c. One-way ANOVA followed by two-sided post-hoc Tukey test. Biologically independent animals used for Lipidomics: n=4 per diet. Means ± SEM, *** p<0.001.
Extended Data Fig. 8
a, Cellular uptake profiles of exogenously supplied NBD-PG by explant-cultured adipocytes. Lipids were separated by TLC and analyzed by fluorescence scanning. The TLC analysis was done once with lipid extracts from n=3 biologically independent mice per diet (indicated above) with n=3 technical replicates each. For each biological replicate, two technical replicates were co-incubated with NBD and one with just the transfection agent. Dashed line represents the paths used to quantify fluorescent signal distribution in Fig. 6d. Dashed boxes represent the areas used to quantify individual bands. Lipid species with low polarity run on top, with TGs being represented by the top band. Fluorescent lipids run slightly lower than non-fluorescent lipids. Standard phospholipids allowed the identification of lipid spots representing triglyceride (TG), diglyceride (DG) and PG levels (the asterisks indicate unidentified lipid species). Applied non-fluorescent standard lipids involve: Tetra-oleoyl CL (TO-CL); CL-rich phospholipid-extract from heart; palmitoyl-oleoyl-DG (PODG), di-oleoyl-PG (DOPG); di-oleoyl-PA (DOPA). Fluorescent NBD-labeled lipids involve: PG, PA, PC, PE, PS. b, Relative fluorescent signal in each of the major bands. n=3 biologically independent, 24 months old animals per diet; technical replicates were averaged prior analysis. Two-sided t test. Data for TG band are shown in Fig. 6E. c, Non-fluorescent scans of identical TLC plate after staining with CuSO4. Due to high abundance of TGs (upper band) in adipocytes, no phospholipids can be observed. Standard phospholipids allowed the identification of lipid spots.
Extended Data Fig. 9
a-b, Analysis of lipid pathway activity in WAT of ALDR a or DRAL b fed mice relative to AL control. Red and blue arrows show reactions with positive and negative activity, respectively. Colored circles indicate relative log2-transformed abundance of lipid classes involved. Green arrows indicate the major predicted lipid flux across the network. c, mRNA expression (RNA-seq) of key genes mapping to differentially active pathways in Fig. 7a. Two-sided Wald test, adjusted for multiple testing. Biologically independent animals used: RNA-seq: n=3 (AL, DR, ALDR, AL 5m) n=5 (ALDR, DRAL); Lipidomics: n=4 per diet. Means ± SEM, *** q<0.0001.
Supplementary Material
Supplementary Table 5
Supplementary Table 1-4
Acknowledgments
We thank Richard Weindruch, James Nelson, Rich Miller, Colin Selman, Dominic Withers and Friedemann Kiefer for their advice on the mouse dietary restriction protocol and Dietmar Vestweber and the Max-Planck-Institute for Molecular Biomedicine, Münster, for kindly allowing us to conduct our studies at their facilities. We further thank Ina Gravemeier, Ulrich Hill, Jennifer Matutat, Andrea Mesaros and Brit Neuhaus for assistance with mouse work. We thank Tony Wyss-Coray and the Tabula Muris consortium for kindly granting access to their single-cell transcriptome atlas, and for advice and supervision during the corresponding analysis.
We acknowledge funding from the Max Planck Society, Bundesministerium für Bildung und Forschung Grant SyBACol 0315893A-B (to AB and LP) and the European Research Council under the European Union’s Seventh Framework Programme (FP7/2007-2013)/ERC grant agreement number 268739 to LP. MJOW, AN and QZ thank the BBSRC (BB/P013384/1) and the MRC (MR/M004821/1) for financial support.
Footnotes
Data availability
The data that support the findings of this study are available from the corresponding authors upon request. Raw bulk RNA-sequencing data are available under accession numbers {"type":"entrez-geo","attrs":{"text":"GSE92486","term_id":"92486"}}GSE92486 and {"type":"entrez-geo","attrs":{"text":"GSE124772","term_id":"124772"}}GSE124772 on the NCBI Gene expression Omnibus database. Analysed lipidomics data are available under Supplementary Table 5.
Contributions
SG, AB, MJW and LP designed the experiments and drafted the manuscript together with OHa. SP conceptualized and performed power analyses to determine the required number of animals for the switch experiments, and guided the mortality data analysis. OHe performed the RNA-seq. LFD performed qPCR and western blot experiments. TT and TL designed and conducted the in-vitro pulse chase experiments with LFD and LG. QZ and MJW conducted the lipidomic profiling. AN conceptualized and performed the lipidome network analysis. OHa performed most of the lifespan and bioinformatic analyses. All authors read and approved the final manuscript.Competing interests
The authors declare no competing interests.
