- Journal List
- J Gerontol A Biol Sci Med Sci
- PMC6625587

Effect of Food Predictability on Life Span in Male Mice
Neil E Rowland
1Department of Psychology, University of Florida, Gainesville
Kimberly L Robertson
1Department of Psychology, University of Florida, Gainesville
Dulce Minaya
1Department of Psychology, University of Florida, Gainesville
Vanessa Minervini
1Department of Psychology, University of Florida, Gainesville
Melissa Cervantez
1Department of Psychology, University of Florida, Gainesville
Kathryn A Kaiser
2School of Public Health, University of Alabama, Birmingham
David B Allison
2School of Public Health, University of Alabama, Birmingham
Associated Data
- Supplementary Materials
- gly231_suppl_Supplementary_Material.GUID: 1E9B8211-5960-416E-8812-BB7167AA8011
Abstract
The purpose of this study is to compare the effect of unpredictable (U) or predictable (P) food delivery on health and longevity in mice. From 2 months of age until end of life, singly-housed male C57BL/6 mice were fed a semisynthetic diet either ad libitum (AL), or as imposed meals delivered as small pellets at either P or U times, frequencies, or amounts. The total daily food consumed by all groups was the same. The AL group gained body weight faster than either P or U groups, and had ~12% shorter median life span compared with either P or U groups. Bimonthly noninvasive body composition determinations showed that the differences in body weights were due to differences in fat and lean mass. Postmortem examinations revealed that the organ pathologies were similar in all groups, but a larger fraction of P and U mice were euthanized due to end-of-life suffering. There were no systematic differences in outcome measures between P and U groups suggesting that, within the range studied, the temporal pattern of food delivery did not have a significant metabolic effect.
In affluent populations, lower-income individuals and families often experience food insecurity including the regularity and/or quality of food (1,2). Such insecurity produces both physiological and psychological stress (3). While adaptation to episodes of food insufficiency represents an evolutionarily normal challenge, high food insecurity is correlated with increased risk of obesity and decreased life expectancy (4–6). However, many factors other than diet quality and patterns are present in such human populations, so evidence from a controlled preclinical study is important.
The purpose of the present investigation is to examine the effects on life span of a feeding regimen designed to emulate the perception of food insecurity in a mammalian model. Mice (Mus musculus) were delivered food in a predictable (P) or unpredictable (U) manner for their entire postadolescent life. The particular P and U regimens that we used involved variation in meal size and frequency of food presentation without difference in daily amount. It was hypothesized that the perception of unpredictability would increase body weight/fat mass and decrease life span. Due to the equipment demands of this study, the need to have adequate numbers of mice per group and the desire for consistency with a set of related studies all funded under the same grant, a strategic choice was made to use only males.
Methods
Animals
Male C57BL/6 mice (N = 144) were purchased at 2 months of age from Jackson Laboratories (Bar Harbor, ME). All procedures were approved by the UF IACUC, including provisions for increased veterinary surveillance and euthanasia as the animals aged. Full details of maintenance conditions and veterinary procedures are presented in the Supplementary Methods.
Procedure
After an acclimation period of 1 week, mice were assigned to one of three groups matched for body weight (Ns = 48). An ad libitum (AL) group was given excess full-sized (~1 cm diameter) cylindrical food pellets in the overhead lid/food hopper; this group represents standard housing conditions and serves as a reference. The other two groups, P and U, received the same diet in the form of 45-mg pellets which were dropped through the lid of each cage from a pellet dispenser fitted with a delivery tube. The pellet dispensers (Med Associates, St. Albans, VT) were controlled by a computer running MedPC-IV software.
The number of 45-mg pellets to be delivered daily to the P and U groups was calculated each week to equal the mean daily intake of the AL group the previous week. That intake was rounded to the nearest multiple of five 45-mg pellets. The P group received this number of pellets in five equally-sized meals at 3-hour intervals with the first delivered just before lights out and the last just before lights on. The U group received the same number of pellets but programmed to be delivered in a number of meals per day randomly ranging from 3 to 12. The size of meals was determined by a probability distribution (7) and with the constraints that all meals occurred between the start and end of the night, were spaced at least 1-hour apart, and the daily amount was the same as for the P group. After 100 weeks of age, intakes of the AL group declined slowly, so delivery to the P and U groups was held constant at the near-plateau value of 85 pellets (3.825 g) per day for the remainder of the experiment. Additional details of procedure may be found in the Supplementary Material.
Diet
All animals received purified ingredient AIN93G diet (Test Diet, Richmond, IN) with nominal composition, by weight, 18% protein and 7% fat, yielding 16.4 kJ/g. For the AL group, these were standard pellets and for the U and P groups were 45-mg pellets. Animals were transitioned from the growth diet (G) to the AIN maintenance formulation at ~6 months of age, and this was planned as the diet for the rest of the study. However, the maintenance formula pellets crumbled in the food dispensers, creating malfunctions. The resultant missed food deliveries caused a transient drop in body weight for some mice in P and U groups such that, after 3 weeks, the G formulation was reinstated for the remainder of the study.
Dependent Measures
Mice were weighed once a week, at about midday, when their cage bedding was changed. Every 8 weeks, starting at ~6 months of age, body composition was measured noninvasively using time domain Nuclear Magnetic Resonance (NMR, Bruker BioSpin TD-NMR minispec LF50 Body Composition Analyzer, Rheinstetten, Germany). Absolute masses of fat, lean tissue, and water were provided by the scan, as well as respective % relative to body mass. Additional details of the instrument and use are presented in the Supplementary Materials.
Near the end of their life spans, animals ate less, lost weight, and showed physical deterioration, as is typical. To minimize any suffering associated with these end-of-life events, a euthanasia protocol was developed. The age at euthanasia was used as the life span of that animal; for all others, it was the age at spontaneous death. In all cases, simple necropsy was performed to determine whether major organ pathology was present, and gross observations were recorded. Further details, and data from the necropsies, may be found in the Supplementary Materials.
Data Analysis
Data were analyzed using one-way ANOVA or ANCOVA followed by post hoc tests for between-group comparisons with p < .05 (two-tailed) being considered statistically significant. Additional details of analysis are presented in Supplementary Methods.
Results
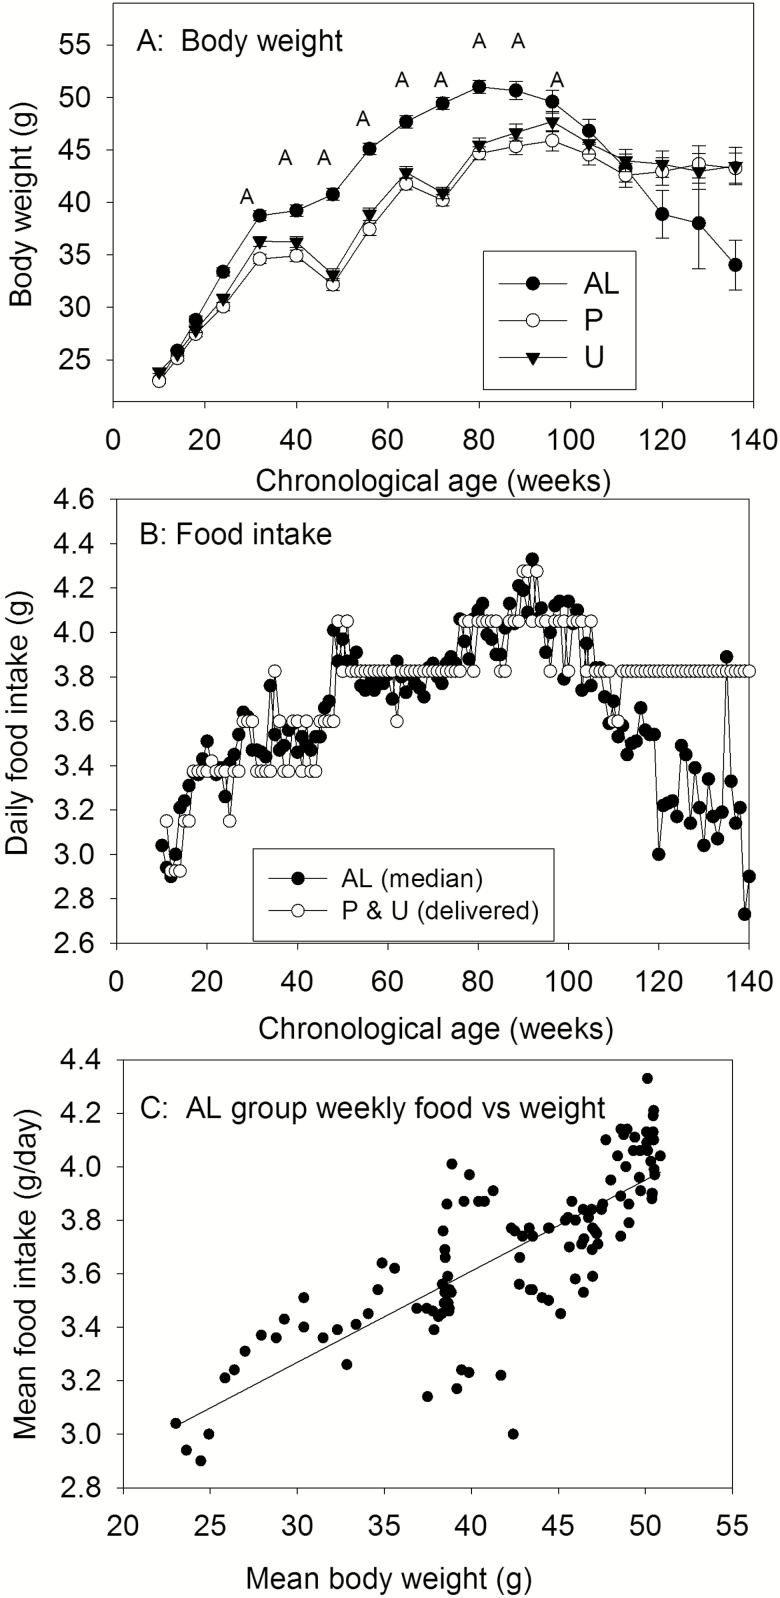
The top panel of Figure 1 shows the mean weekly body weights of each group. The Ns were initially 48, but declined toward the end of the study as animals died. In the AL group, body weight increased monotonically to a maximum at about 90 weeks of age, then declined. The P and U groups weighed significantly less than AL mice between 25 and 97 weeks of age (one-way ANOVAs); thereafter, group differences were not significant. The P and U groups also showed transient declines in weight around weeks 45 and 70, a direct result of problems of technical problems with food delivery, as noted in Methods. Body weights of the P and U groups did not differ significantly except at 32 weeks of age (U>P).
(A) Mean (+SEM) body weights of ad libitum (AL), predictable (P), or unpredictable (U) food groups as a function of chronological age. (B) Median daily food intake of AL group (solid symbol) through the study, and amount of food received by P and U groups (open symbol). (C) Mean food intake of AL group plotted against mean body weight at each week of the study. Linear regression fit is shown (r2 = .64).
The middle panel of Figure 1 shows median daily intakes of the AL group across the course of the experiment and the actual amounts of food delivered (the next week) to the P and U groups. Intake of the AL group declined after about week 100 of age so, to avoid inadvertent deprivation of the P and U groups, their food delivery was held just below the plateau level for the remainder of the experiment. Except near end of life, all delivered food was consumed before the start of the next day deliveries, although we cannot state that it was eaten immediately after it was delivered. The bottom panel of Figure 1 shows, at weekly intervals, the mean food intake of the AL group plotted against mean body weight. The relation is linear, with intake increasing by about 0.1 g for every 3 g increment in body weight.
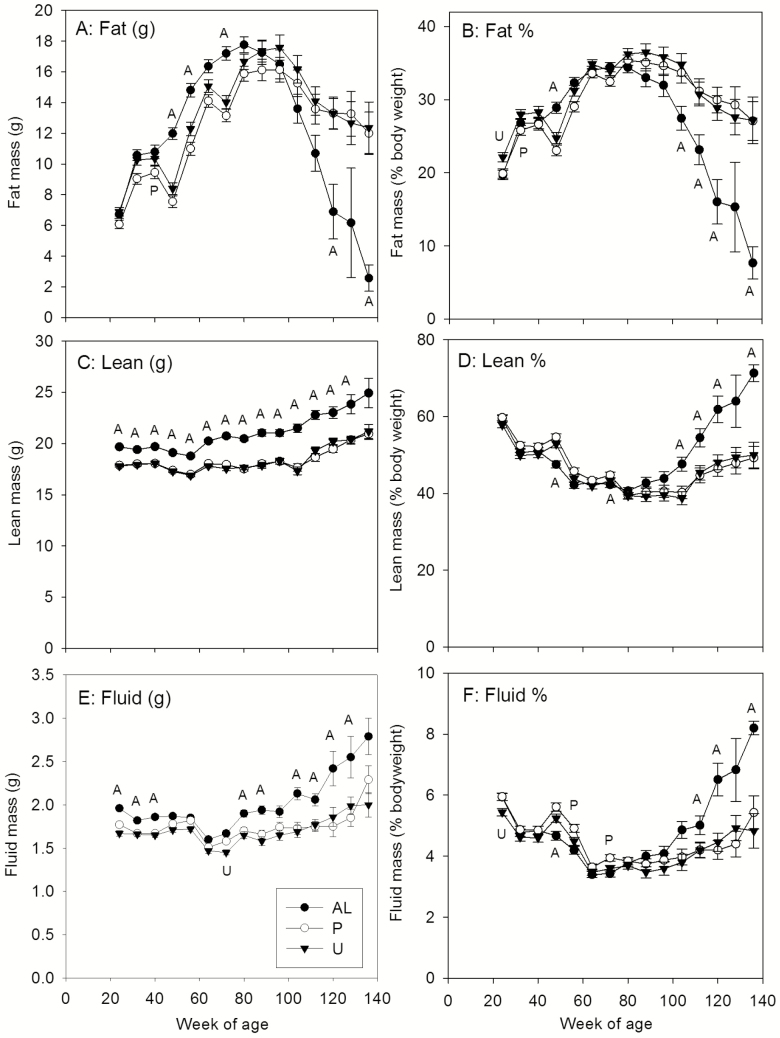
The results of the bimonthly NMR determinations are shown in Figure 2, with data expressed both in absolute and relative units. One-way ANOVAs were conducted for each measure and determination, and group differences assessed by Holm-Sidak tests. The top panels show fat mass. Absolute fat mass was higher mice of the AL group compared with P and U between weeks 45–70, and was lower toward the end of life (week 110 onward). However, expressed relative to body weight, only the end-of-life difference between groups for fat mass and fat percent was consistently reliable. The U or P groups differed from the other groups at weeks 25 and 33, respectively, but since these differences were small and not sustained, we do not consider them important. Percent body fat correlated significantly (ps < .001) with body weight in each group at each time point (all r > .66; median 0.87).
Mean (+SEM) NMR bimonthly determinations of absolute (left panels) and relative fat mass (A,B), lean mass (C,D), and fluid (E,F) of ad libitum (AL), predictable (P), and unpredictable (U) groups as a function of chronological age. For each measure and age, a letter and position (above, below line) signifies that group differs (p < .05) from the other two groups.
The lean body mass data are shown in the panels C and D of Figure 2. The lean mass of the AL group was higher than the other two groups throughout the study, except at the end when only a few AL mice were surviving. However, until about 100 weeks of age, these differences were generally proportional to body mass (panel D). As the AL mice lost weight later in the study (Figure 1), comparison of Figure 2 panels B and D reveals that this loss was almost exclusively fat mass. Lean body mass (%) was negatively correlated (ps < .001) with both body fat (median r = −.97) and body weight (median r = −.87).
The body fluid content is shown in the panels E and F of Figure 2. As for lean mass, the AL group had higher absolute fluid mass at most determinations (panel E) but, except near end of life, this was proportional to body mass (panel F). The P and U groups showed sporadic and small differences in fluid content from the other groups, but there were no consistent or sustained trends.
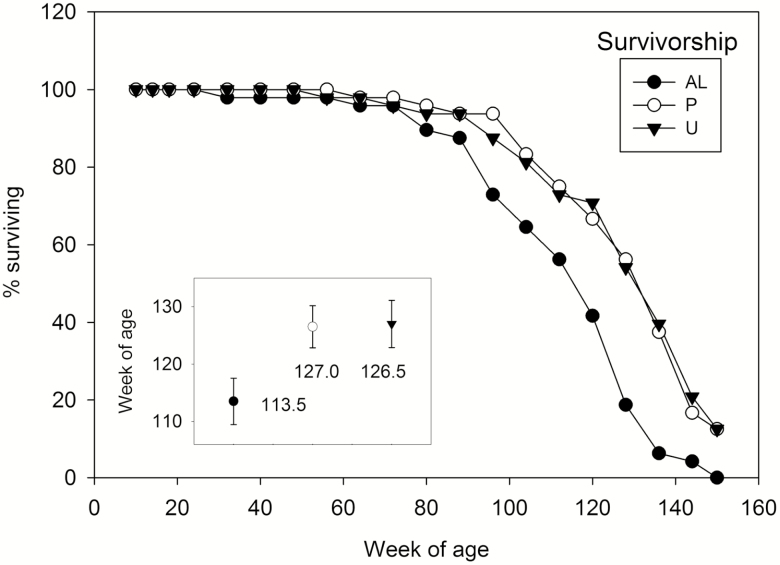
The percentage of animals surviving at the end of each 8 week interval are shown in Figure 3. P and U mice remaining in good health at 150 weeks of age (five in each group) were euthanized and this was recorded as their life span. The median age of death in the AL group (113.5 weeks) was significantly less (p < .01) than those of the P and U groups (127 and 126.5 weeks, respectively). Additional details of life span, as well as maximum weights and fat contents, are presented in the Supplementary Material. Organ pathologies or other reasons for death or euthanasia were generally similar in each group and are presented in the Supplementary Material.
Discussion
Our study found no difference in life span between male mice on P and U feeding regimens, but both had longer life span than mice fed AL. Thus, our hypothesis that the U regimen would have an adverse effect on body fat and health relative to P was not supported.
A recent study using zebra finches (8) found that an unpredictable food regimen was associated with increased life expectancy relative to a predictable food regimen. Aside from the difference in vertebrate class, there are several important divergences in procedure and nomenclature. We used singly-housed male mice while the zebra finches were group-housed females. Our mice started their lifelong food regimens at 2 months of age whereas the U regimen in the finches did not start until 5 months of age and was interrupted by three seasons of breeding during which free food was available. Insofar as food was available at all times, our AL group is most similar to the P group of finches. Lastly, both our P and U groups had periods during which food was not available but, unlike in the finches, did not have different durations of food access.
The food schedules used in the present study were designed to produce differential certainty about timing of the next food delivery. The AL group had no uncertainty because food was always present. In contrast, both P and U groups endured periods without food, with the difference that food deliveries (as meals) were either P or U. At night, the imposed interval between the start of meals was always 3 hours in the P group, but ranged from 1 to 9 hours in the U group. We have no direct evidence that the P group learned or perceived predictability, although we expect they did because rodents have excellent circadian or ultradian timing abilities of predictable events (9).
Through 100 weeks of age, the three groups consumed almost identical amounts of food (Figure 1). However, while the AL group were able to individualize both the amount and timing of their intake, the P and U groups received uniform amounts. Uneaten pellets were only rarely found in the bedding of P or U groups, usually related to illness or approaching end of life. Despite identical food delivery to mice in the P and U groups, substantial individual differences were evident in body weight and fat. This variance may reflect differences in basal metabolic rate, efficiency, and/or in voluntary activity. The higher or earlier maximum body weight of the AL group is consistent with a hypothesis that P and U regimens induced higher activity in anticipation of food, but direct measurement will be needed to test that hypothesis.
Mice are inactive during most of the daytime, punctuated by one or two larger feeding bouts or meals (10). It is likely that the AL group in the present study engaged in such a pattern of feeding and activity and this was confirmed from a single occasion measure at about 6 months of age in which we confirmed a daytime intake averaging 25% of the daily total. Food delivery in neither P nor U groups conformed to this pattern. Further, while delivery of the pellets within a programmed meal (every 5 seconds) was faster than the animals could consume it, we cannot say exactly when that ration was consumed or whether that was different for deliveries at different parts of the night.
Several recent studies have emphasized the importance of synchronized circadian metabolic rhythms in energy regulation (11). For example, Hatori et al. (12) showed that relative to male B6 mice fed standard chow ad libitum, those with chow access for only 8 hours at night showed a body weight trajectory (from about 12–32 weeks of age) some 5%–10% lower despite identical absolute food intake, a result that is consistent with our present differences between AL and either P or U groups. Kuroda et al. (13) concluded that the phase of selected peripheral metabolic oscillators in mice was not changed if food was delivered in fixed amounts at fixed intervals, but was phase advanced by irregular or restricted feeding. Neither of these studies were similar enough in design to allow us to make definitive parallels to the present study but we have shown that some features of episodic food delivery (P and U) induce metabolic or behavioral differences in mice, lower maximum weights and substantially (~14%) longer life expectancy than AL feeding. If these results may generalize to humans, they suggest that modest temporal restriction of food access has substantial health benefits but that the pattern or predictability of that restriction may be less critical.
Funding
This work was supported by the National Institute on Aging at the National Institutes of Health, grant number AG043972 (D.B.A.).
Supplementary Material
gly231_suppl_Supplementary_Material
Acknowledgment
We thank Mr. Amit Patki in the School of Public Health at University of Alabama at Birmingham for assistance with the statistical analyses.


